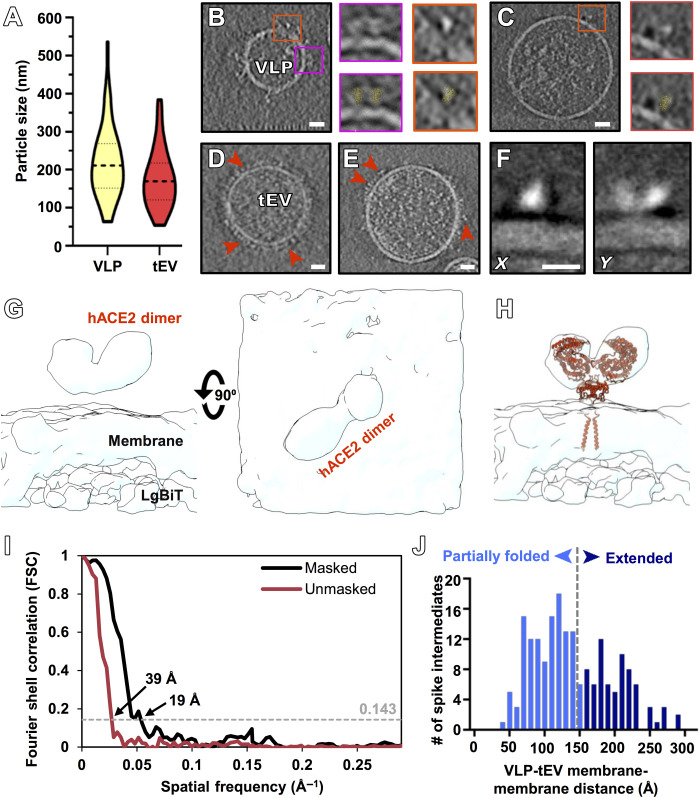
Fig. 2. Visualization of VLPs and tEVs by cryo-electron tomography.
(A) VLPs (yellow) and tEVs (red) show particle sizes ranging from 50 to 500 nm with a mean of 200 nm for VLPs (n = 50) and 175 nm for tEVs (n = 50). (B and C) Contrast-inverted tomogram slice of two different-sized VLPs. Insets show prefusion spikes without (top insets) and with (bottom insets) prefusion spike atomic model (PDB ID: 5x58) fit into the raw tomogram densities. (D and E) Contrast-inverted tomogram slices of tEVs at 4°C (D) and 37°C (E) with densities attributable to hACE2 on the surface of tEVs (red arrowheads). (F) X and Y projections from the final subtomogram reconstruction of hACE2. (G and H) Side view and top view without (G) and with (H) hACE2 model (PDB ID: 6M1D) (11) fit into the subtomogram averaged density map. (I) Fourier shell correlation (FSC) plots of the hACE2 density map with and without a mask. (J) Distribution of VLP membrane to tEV membrane distance measurements where spike intermediates were identified. Intermediate spikes whose VLP membrane to tEV membrane distance measured less than 15 nm (n = 116) were in a partially refolded state, while above 15 nm (n = 76), these spikes were in an extended state. Spike intermediates range from 3 to 29 nm (n = 192). Scale bars, (B to E) 10 nm and (F) 5 nm.

