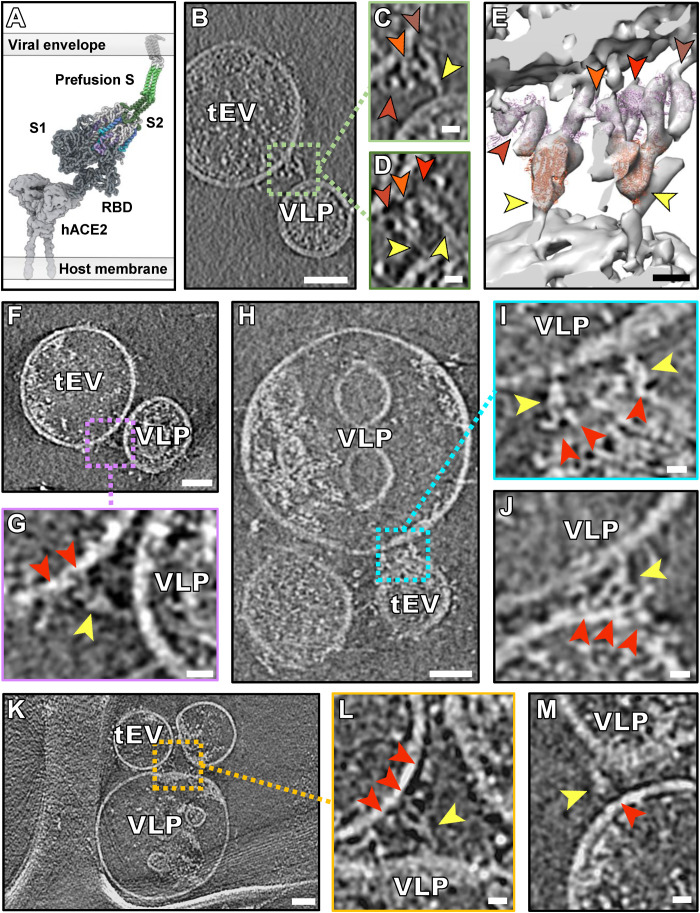
Fig. 3. Interaction between hACE2 and prefusion spike.
(A) Schematic derived from a coarse-grained molecular mechanics (CG-MM) simulation guided by the tomographic densities of prefusion spike (S1 + S2) bound to hACE2. (B, F, H, and K) Contrast-inverted slices through tomograms of VLPs containing spike and tEVs containing hACE2. (C, D, G, I, J, L, and M) Enlarged views of tomograms with densities attributed to S (yellow arrows) interacting with densities attributed to hACE2 (shades of red arrowheads). (E) Isosurface representation of a tomogram from (B) to (D) with densities attributed to four hACE2 dimers [shades of red arrowheads corresponding to arrowheads in (C) and (D)] and two S proteins with their RBDs oriented upward (yellow arrowhead). Ribbon models fitted into the density map are displayed in purple for hACE2 (PDB ID: 7L7F) and orange for S (PDB ID: 6X2B). Full set of tomogram z slices and the isosurface representation are displayed as movie S1 for (B) to (E). Scale bars, (B, F, H, and K) 50 nm and (C to E, G, I, J, L, and M) 10 nm.

