. 2022 Aug 11;11:e74183. doi: 10.7554/eLife.74183

Figure 1. Th2 cells of mesenteric lymph node (MLN) and lung adopt tissue-specific RNA signatures.

(A) General experimental outline. MLN and lung cells of two individual Nippostrongylus brasiliensis (Nb)-infected IL-4eGFP reporter mice (4get B6) were sorted for IL-4eGFP+CD4+ cells 10 days post infection. Then combined transcriptome and T-cell receptor (TCR) repertoire sequencing were performed. Flow cytrometry plots show the frequency of Th2 cells (IL-4eGFP+CD4+ cells) in MLN and lung. (B) Uniform Manifold Approximation and Projection (UMAP) representation of MLN and lung cells 10 days post Nb infection. (C, D) medLN and MLN cells sequenced in a separate run were plotted on the existing UMAP defined in the initial MLN + lung sequencing run by integration based on shared anchor genes to demonstrate similarity of medLN and MLN cells. (E) De novo unsupervised clustering approach with manually added cell type description. Clusters are indicated on UMAP. (F) Expression of selected CD4 T-cell subset defining genes, (G) genes that are differently expressed between MLN and lung, or (H) gene signature module scores for single cells plotted on top of UMAP representation. Each of the independent single-cell sequencing experiments is based on two mice.

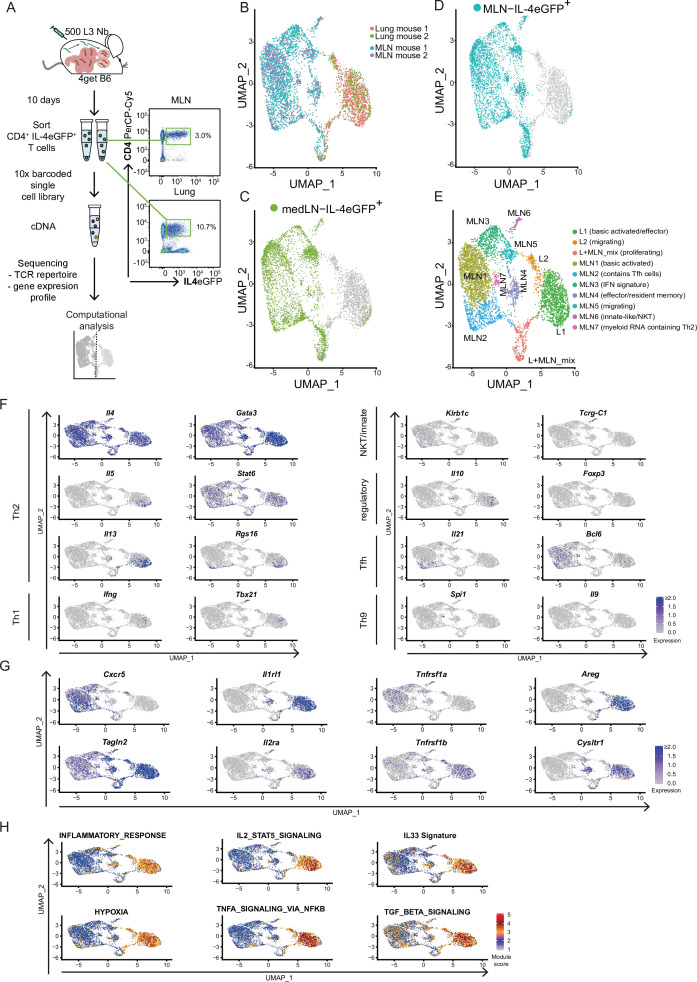
Figure 1.

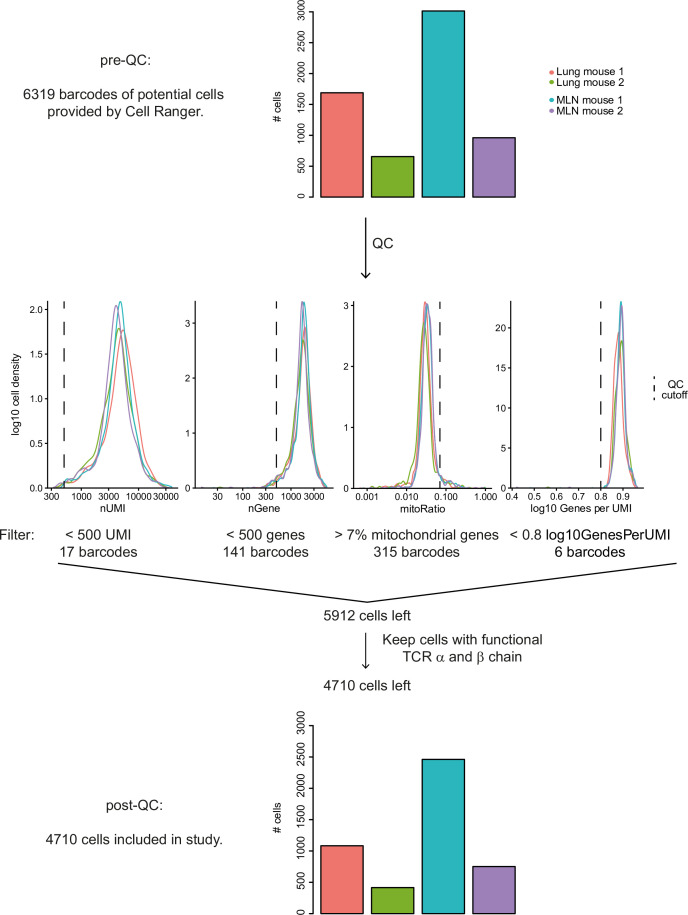
Figure 1—figure supplement 1. Quality control of Th2 single-cell sequencing 10 days post Nippostrongylus brasiliensis (Nb) infection.

Figure 1—figure supplement 1.

Overview of QC workflow. Numbers of potential cells pre-QC are given for different mice and organs (upper panel). Histograms visualize exclusion of potential cells by various cut offs (middle). Numbers of included cells post QC are visualized for different mice and organs (lower panel). Functional T-cell receptor (TCR) chains according to Cell Ranger definition.
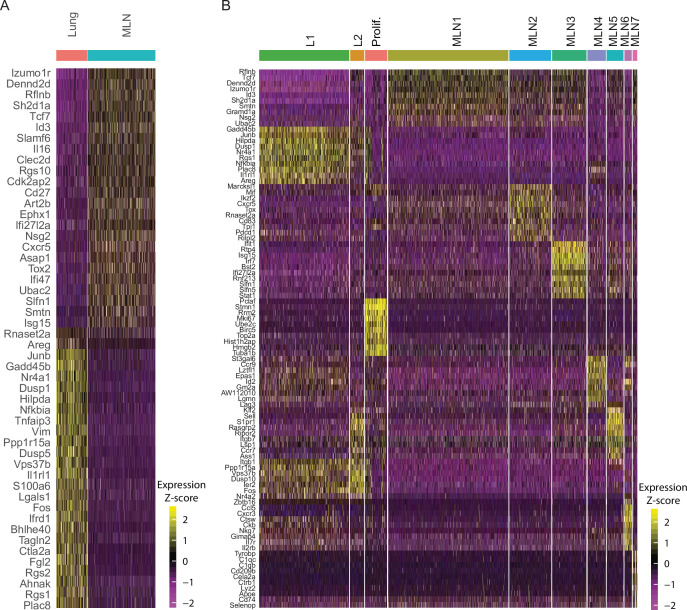
Figure 1—figure supplement 2. Comparison of mesenteric lymph node (MLN) and lung Th2 cells after Nippostrongylus brasiliensis (Nb) infection on single-cell level.

Figure 1—figure supplement 2.

(A) Heatmap of top 25 most up- and most downregulated genes between MLN and lung IL-4eGFP+CD4+ cells. (B) Heatmap of top 10 upregulated genes for each cluster compared to all other cells (related to Figure 1C,D).
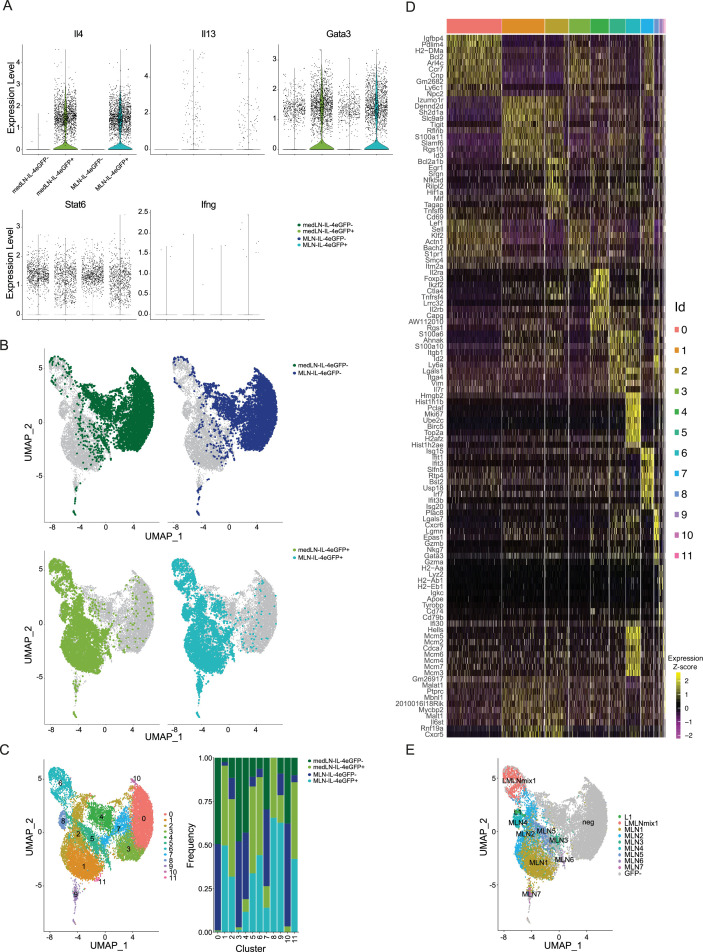
Figure 1—figure supplement 3. Comparison of medLN and mesenteric lymph node (MLN) Th2 cells after Nippostrongylus brasiliensis (Nb) infection on single-cell level.

Figure 1—figure supplement 3.

At day 10 after Nb infection single-cell transcriptome sequencing was performed on IL-4eGFP+CD4+ and IL-4eGFPCD4+ cells from medLN and MLN of 4get mice. (A) Expression of key Th2 marker genes (Il4, Il13, Gata3, and Stat6) and Th1 marker Ifng for comparison. (B) UMAPs of all sequenced cells combined separately overlayed with cells of each condition as indicated. (C) Unsupervised clustering was performed and clusters are indicated on UMAP. Composition of each cluster according to conditions is given (medLN IL-4eGFP, medLN IL-4eGFP+, MLN IL-4eGFP, MLN-IL-4eGFP+). (D) Heatmap of top 10 upregulated genes for each cluster compared to all other cells. (E) IL-4eGFP+ cells were assigned to cluster identities of the MLN and lung sequencing run for comparison. Inferred cluster identities are indicated on UMAP. Sequencing was performed for medLN and MLN of two mice.