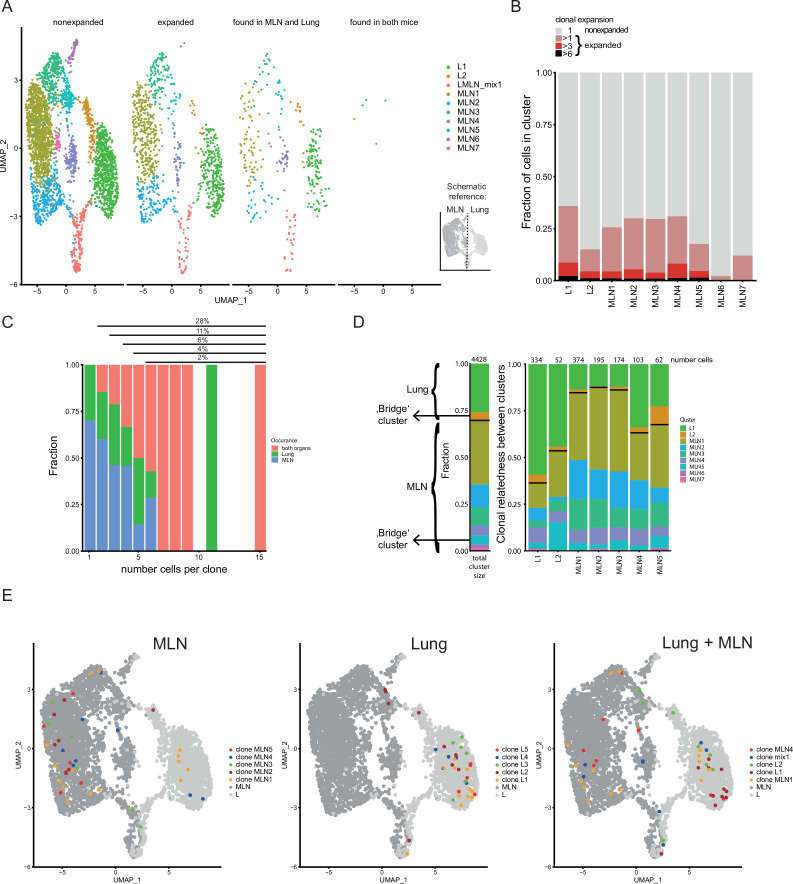
Figure 4. Clonal relatedness of Th2 cells in mesenteric lymph node (MLN) and lung.
(A) UMAP of MLN and lung cells split by cells with unique T-cell receptors (TCRs) (nonexpanded), cells with the same TCRs found in more than one cell (expanded), cells with the same TCRs found in both organs and cells with the same TCRs found in both mice. Cells are colored by cluster. Schematic drawing roughly highlights how MLN and lung cells are separated on UMAP. (B) Stacked bar plot on the presence of expanded clones per cluster. Expansion level relates to overall presence in the dataset. (C) Fraction of cells in MLN, lung, and both organs in relation to clone expansion. Numbers above indicate proportion of expanded cells in total population. (D) Clonal relatedness between clusters. The stacked bar to the left gives the fraction of each cluster in the dataset as a reference (proliferating cluster was excluded). Stacked bar graphs to the right visualize for every expanded clone of a cluster where other members of a clone are found (cluster distribution). Numbers above bars represent the number of cells that each bar represents. Bars for clusters with only few expanded clones are not shown. Black horizontal lines separate the MLN and lung clusters in the bar graphs. Cluster of cells with a migratory signature is highlighted as ‘bridge cluster’. (E) Top 5 expanded clones by occurrence in MLN (left), lung (center), or in total dataset (right).

