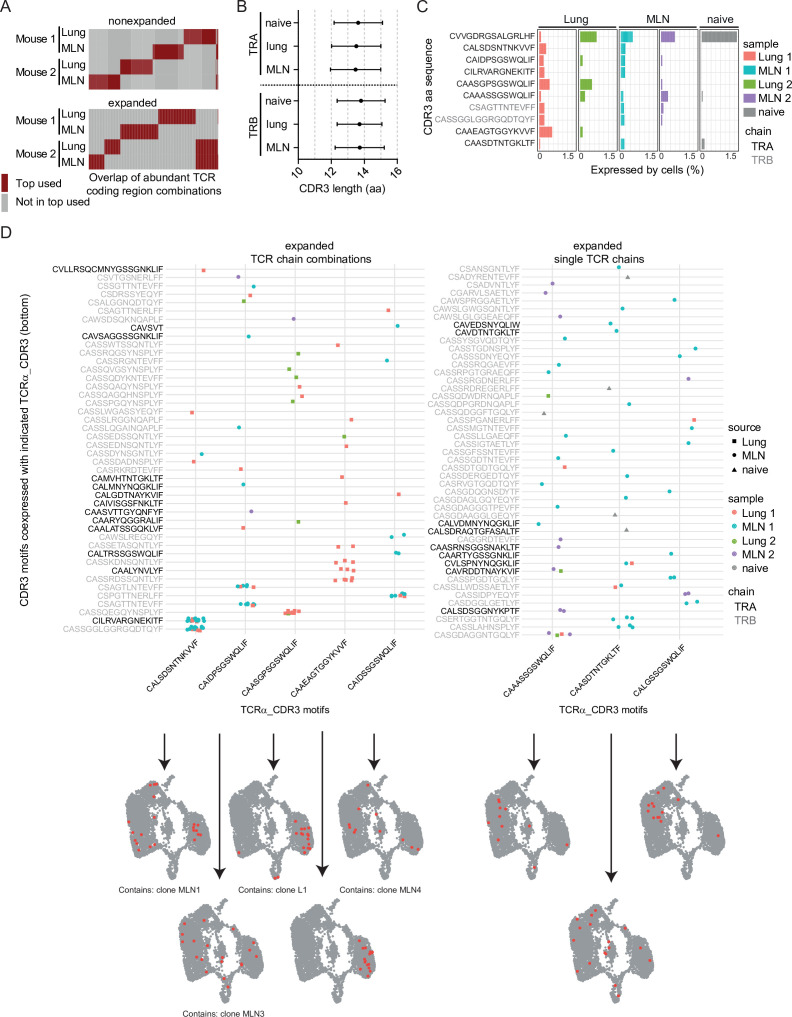
Figure 5. Expanded CDR3 motifs in Th2 cells of Nippostrongylus brasiliensis (Nb)-infected mice.
T-cell receptor (TCR) repertoire analysis of mesenteric lymph node (MLN) and lung Th2 cells at day 10 post Nb infection. (A) TCR segment combination analysis for overlap of the hundred most commonly used TCR segment combinations (V, J, and C region for TCRα; V, D, J, and C region for TCRβ) between different mice and organs. Analysis is performed separately for nonexpanded and expanded clones. (B) Amino acid sequence length of TCRα and TCRβ CDR3 regions. We compare CDR3 regions from peripheral blood T cells of naive wild-type C57BL/6 mice (naive) with CDR3 regions of Th2 cells from MLN and lung of Nb-infected mice. (C) Most abundant CDR3 amino acid sequences in cells of dataset presented as percent of each sample. (D) Combinations of TCRα-related CDR3 motifs (x-axis) with indicated CDR3 motifs of TCRβ or a second TCRα chain (y-axis) that occurred more than once were counted. Then TCRα chains were ranked by abundance in these combinations (left). We also present highly expanded TCRα_CDR3 sequences found in combination with various TCRβ or TCRα chains (right). At the bottom, cells that express the corresponding CDR3 sequences from the x-axis are highlighted on top of UMAP representation of the dataset. We also indicate if a CDR3 sequence is associated with the top expanded clones (Figure 4E) below UMAP plots.


