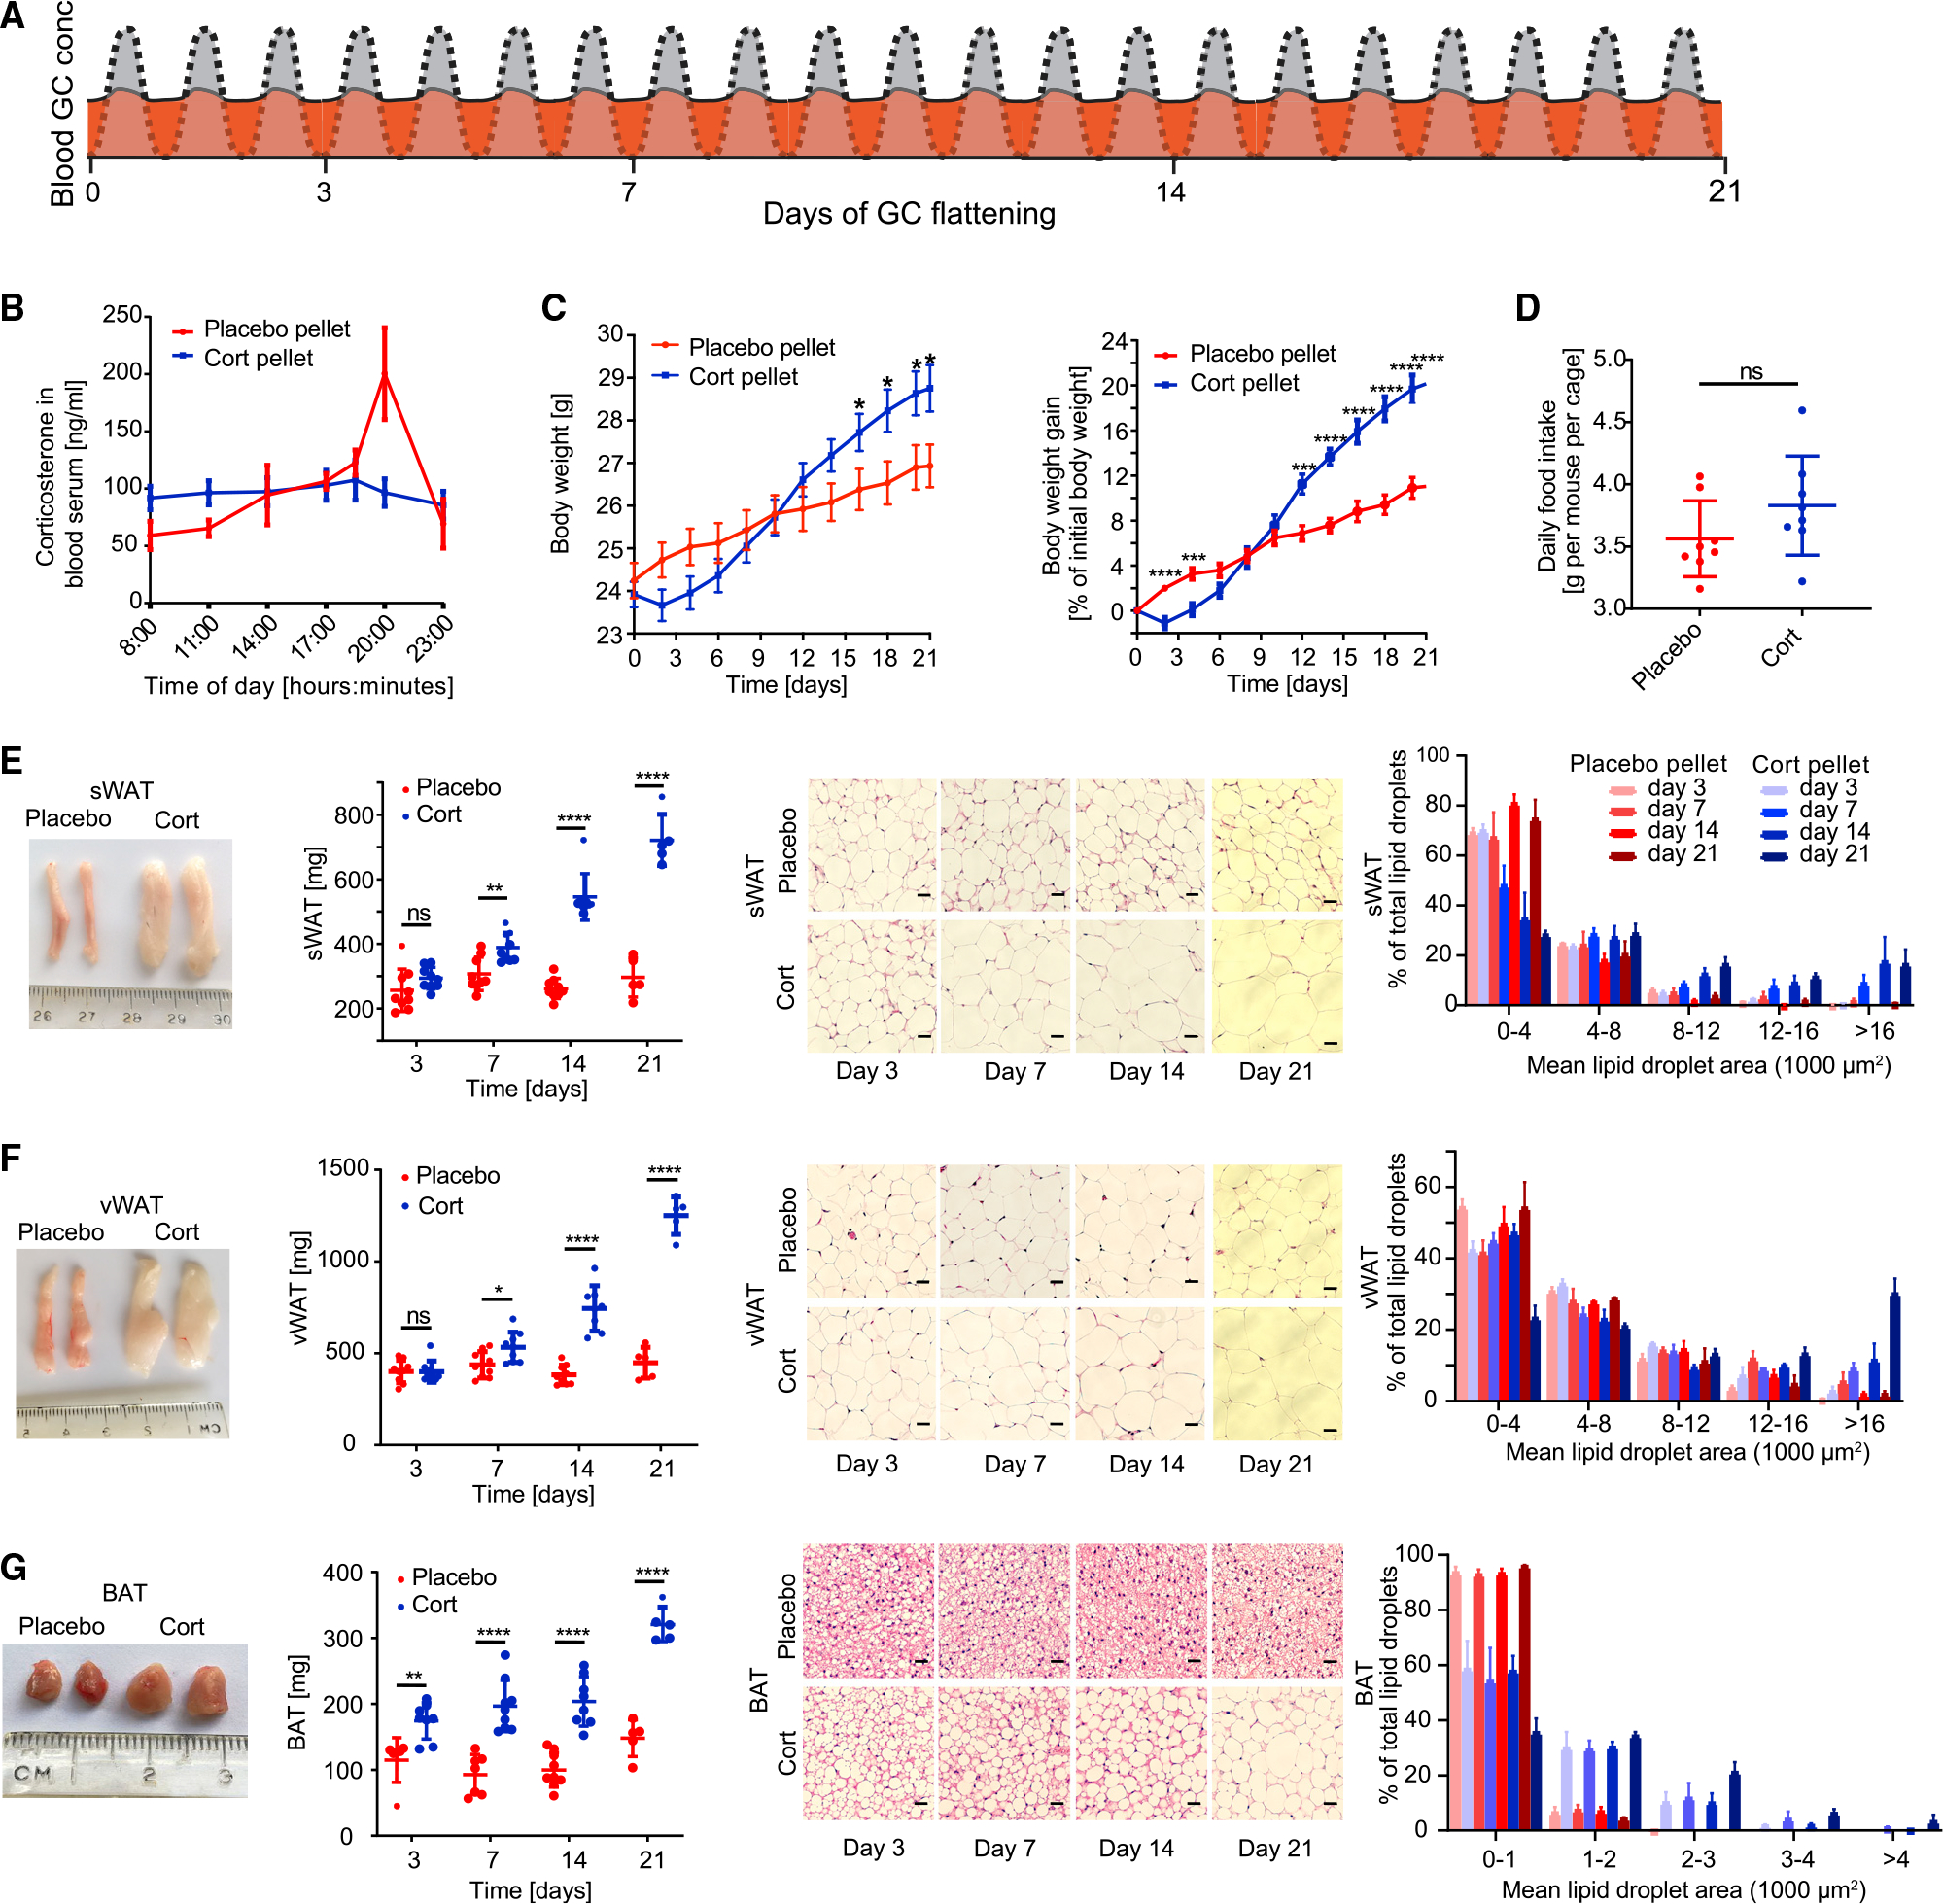
Figure 1. Flattening of circadian glucocorticoid oscillations causes rapid adipocyte hypertrophy.

(A) Schematic of approach used to determine how flattening of GC oscillations affects adipocyte hypertrophy over time. The normal circadian GC oscillation pattern is shown in gray. The flattened GC pattern is shown in orange.
(B) Time course of average corticosterone levels in mice implanted with corticosterone pellets (cort-pellet mice) compared to mice implanted with placebo pellets (placebo-pellet mice) 7 days after pellet implantation. n = 8, means ± SEMs.
(C) Time course showing actual body weight and body weight gain of cort-pellet compared to placebo-pellet mice; n = 11, means ± SEMs. Unpaired t test; *p < 0.05; **p < 0.01; ***p < 0.001; ****p < 0.0001.
(D) Average daily food intake of each mouse per cage (n = 8). Up to 5 mice were housed in each cage. Food intake was monitored for 21 days, means ± SDs. Unpaired t test; ns, not significant.
(E–G) sWAT, vWAT, and BAT fat pad images, fat pad weight, and hematoxylin and eosin (H&E) staining analysis. Fat pad images were taken 3, 7, 14, and 21 days after pellet implantation. Fat pad weight was measured at 3, 7, 14, and 21 days after pellet implantation; n = 5–9, means ± SDs. Unpaired t test; **p < 0.01; ****p < 0.0001. One representative H&E staining is shown for each time point. Scale bar, 50 μm.
See also Table S1.
