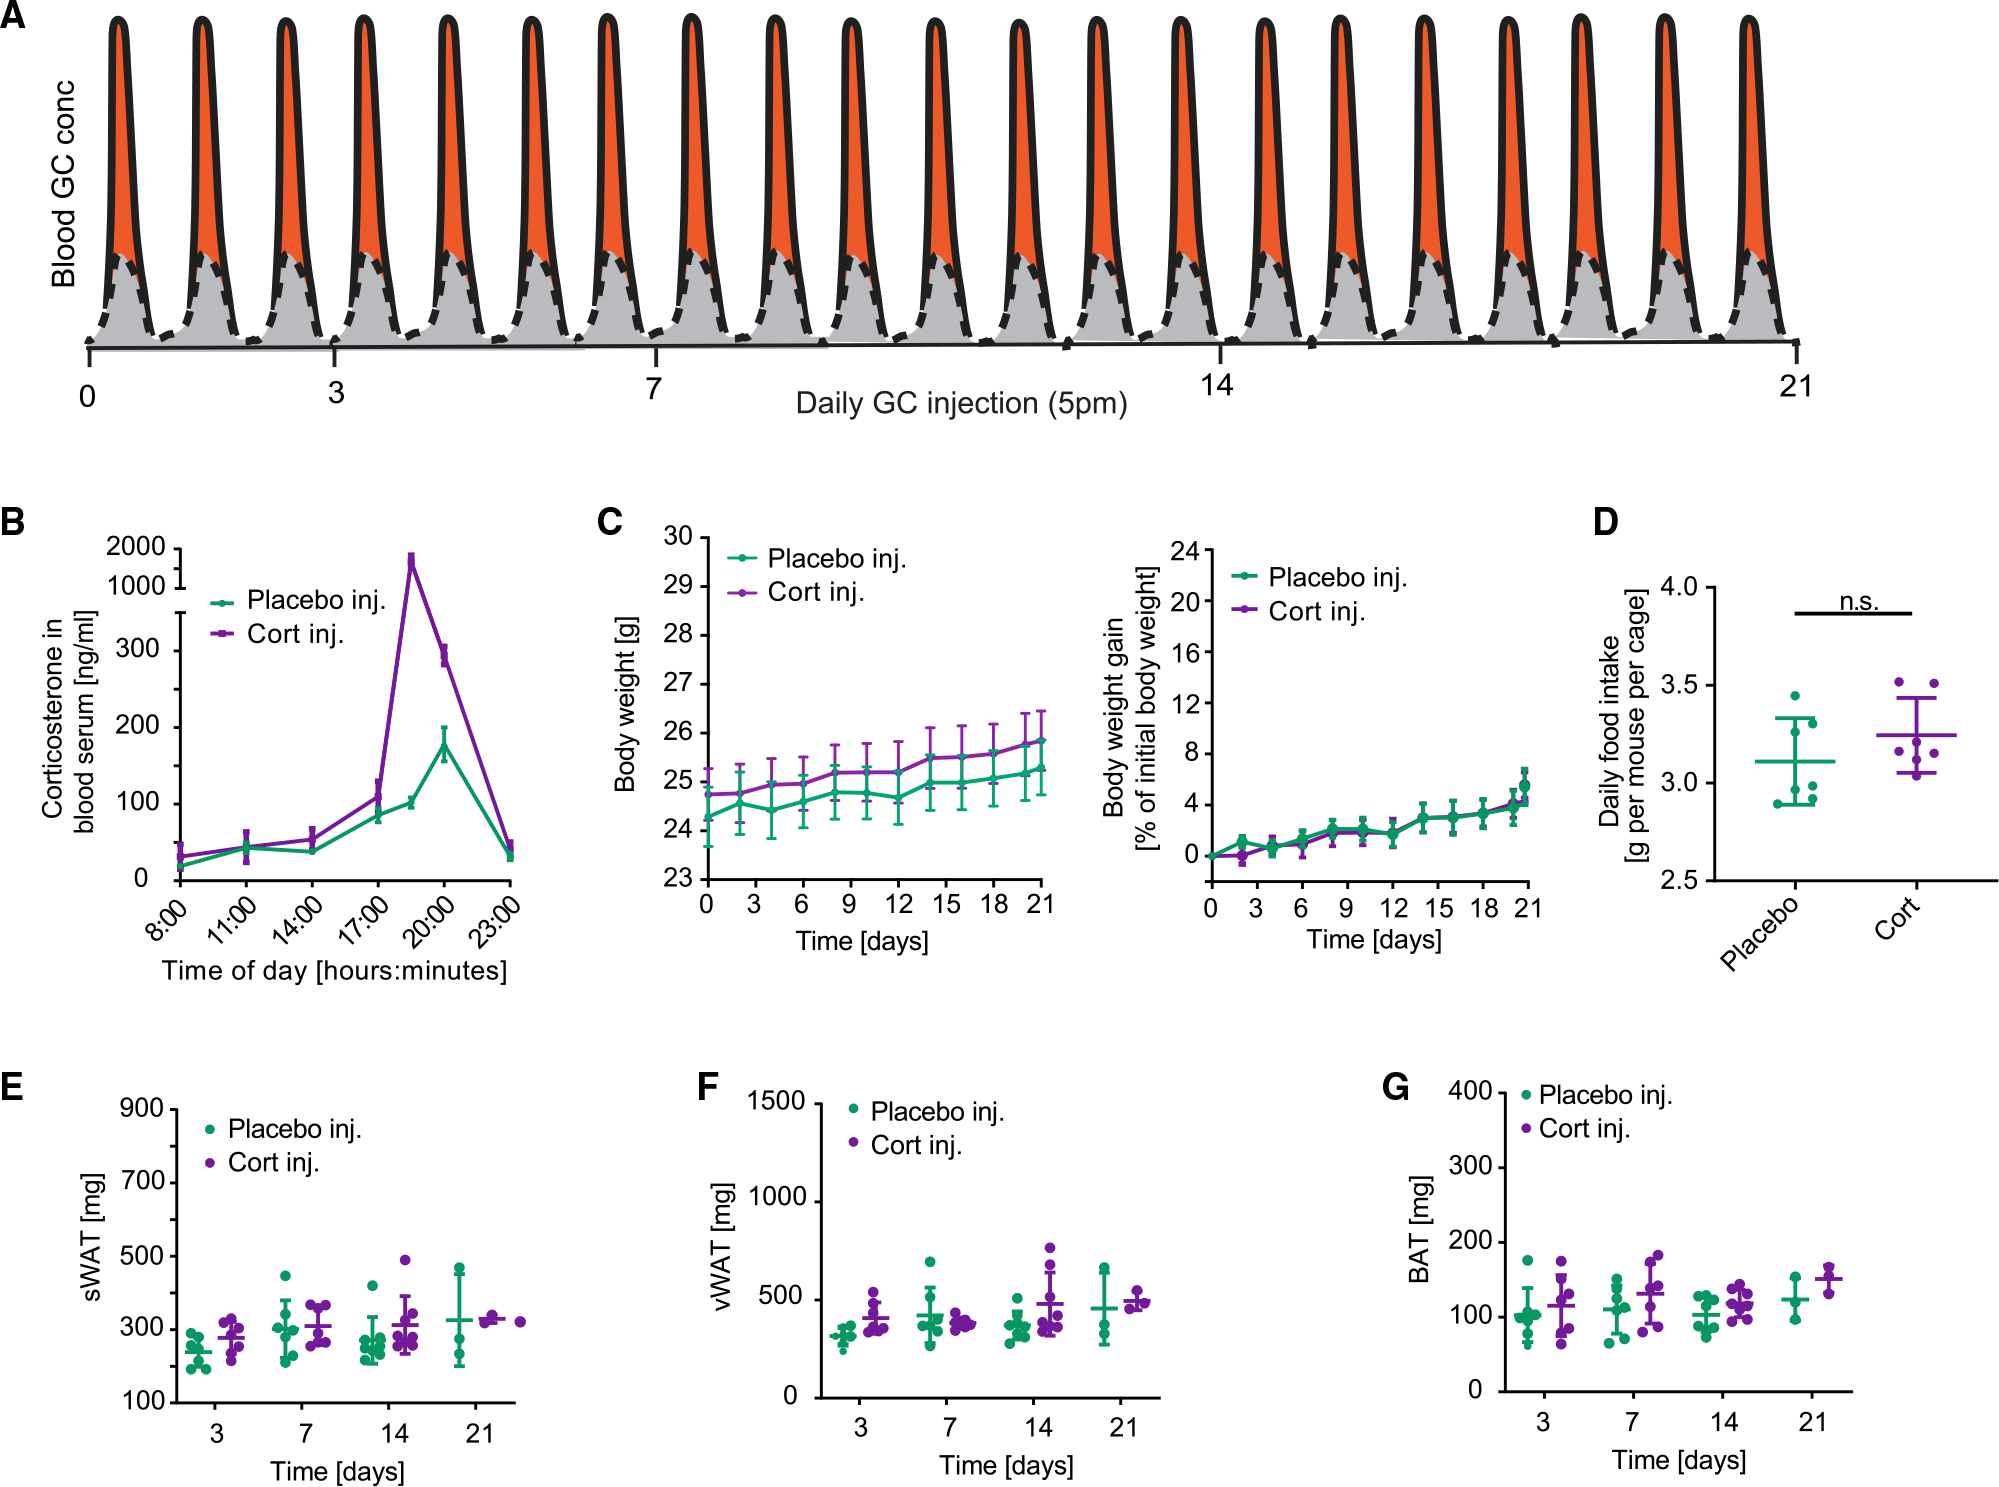
Figure 2. Increasing the peak amplitude of corticosterone in the evening phase does not affect body weight gain or lipid accumulation in WAT and BAT.

(A) Schematic of approach used to determine how flattening of GC oscillations affects adipocyte hypertrophy over time. The perturbation from the normal GC oscillation pattern is shown in orange.
(B) Time course of average corticosterone levels in mice injected with corticosterone compared to mice injected with solvent control (phosphate buffer) 7 days after start of injections. n = 3–4, means ± SEMs.
(C) Time course showing actual body weight and body weight gain of mice injected with corticosterone compared to mice injected with solvent control (phosphate buffer). n = 9, means ± SEMs.
(D) Average daily food intake of each mouse per cage. Up to 5 mice were housed in each cage. Food intake was monitored for 21 days, n = 7, means ± SDs. Unpaired t test; ns, not significant.
(E–G) sWAT, vWAT, and BAT fat pad weight measured at 3, 7, 14, and 21 days after start of daily injections. n = 3–8, means ± SDs.
