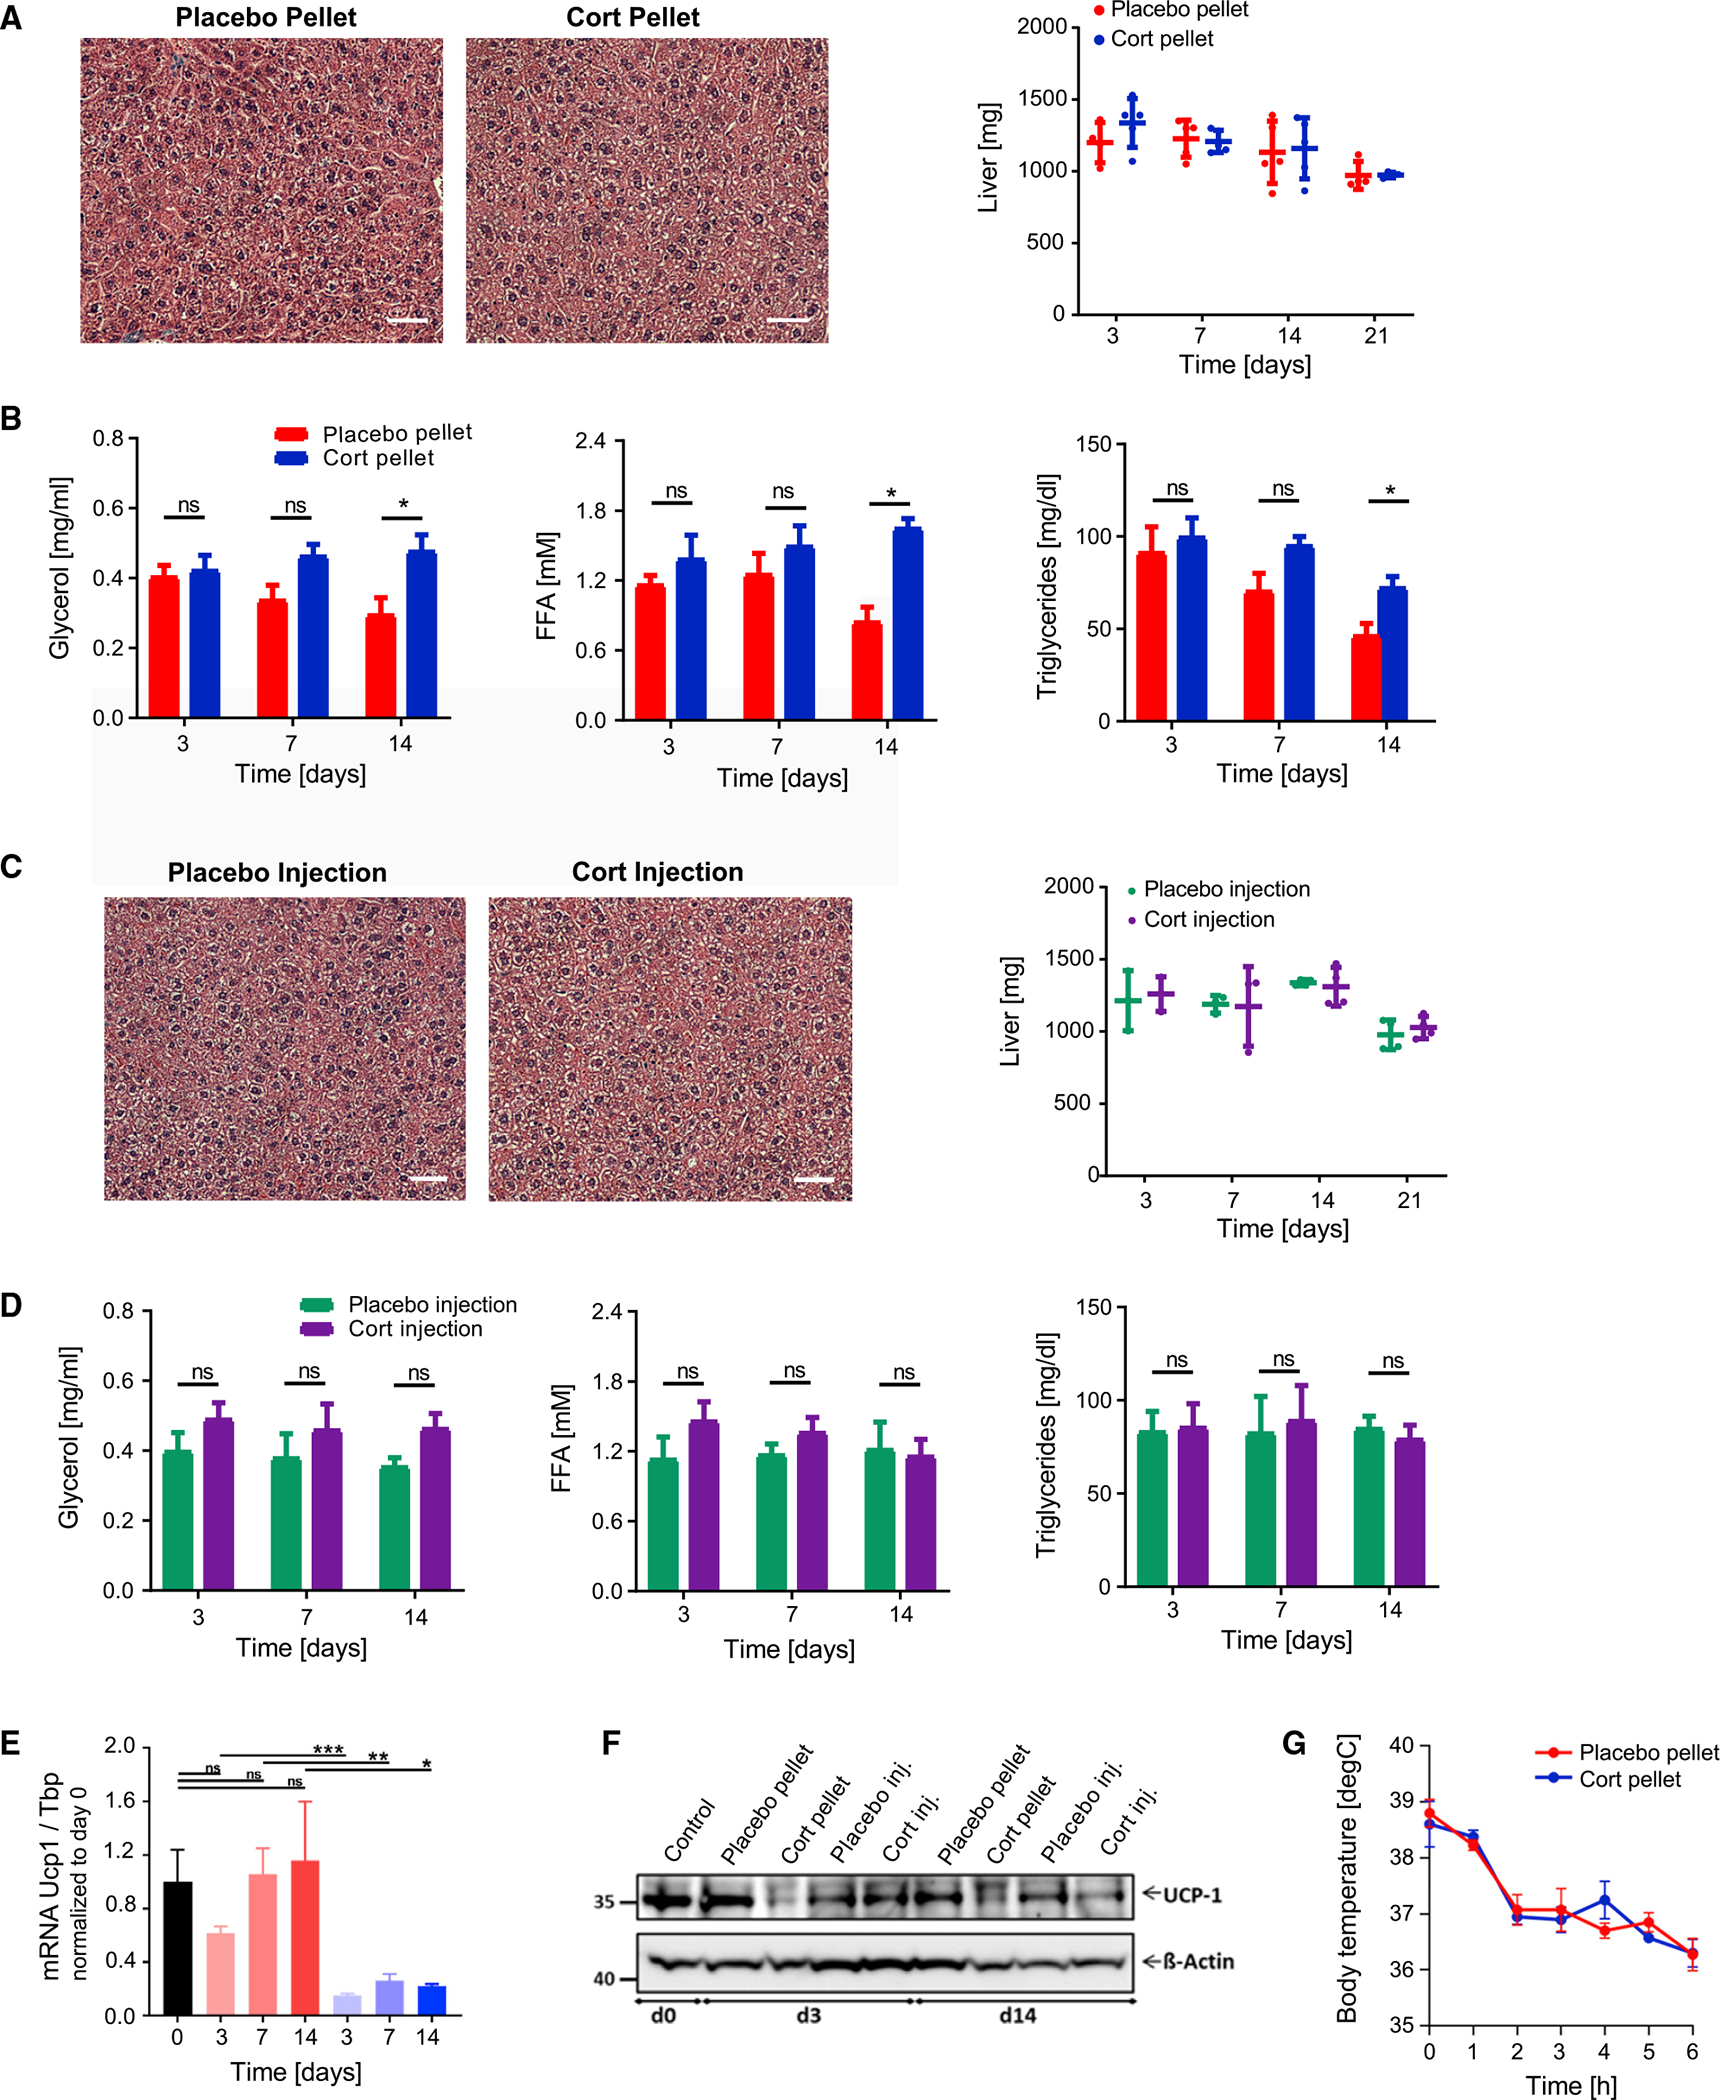
Figure 3. Flattening of glucocorticoid oscillations does not result in fat deposition in the liver, elevated circulating triglycerides in blood serum, or defects in thermogenesis.

(A) Representative image of H&E staining of livers 21 days after placebo or cort-pellet implantation (n = 4). Weight of livers at different time points after pellet implantation. n = 4–5, means ± SDs. See also Table S1 and Figure S3.
(B) Time courses of changes in FFAs, glycerol, and triglycerides measured in blood serum after 14 days in fasted mice. n = 4–5, means ± SEMs, unpaired t test; *p < 0.05; ns, not significant.
(C and D) Same as in (A) and (B), but instead for daily placebo or cort-injected mice, n = 3–4.
(E) Flattening of daily GC oscillations results in downregulation of genes involved in thermogenesis. mRNA expression for UCP-1 measured by qPCR in BAT, normalized to the expression of Tbp, and presented as means ± SEMs (n = 3–4). Unpaired t test; *p < 0.05; **p < 0.01; ***p < 0.001; ns, not significant. Control group are mice at start of experiment (day 0).
(F) Western blot analysis of UCP-1 in BAT lysates (see Figure S3M for quantification).
(G) Acute cold exposure experiment of placebo and cort-pellet-implanted mice 21 days after pellet implantation. Means ± SEMs; n = 8.
