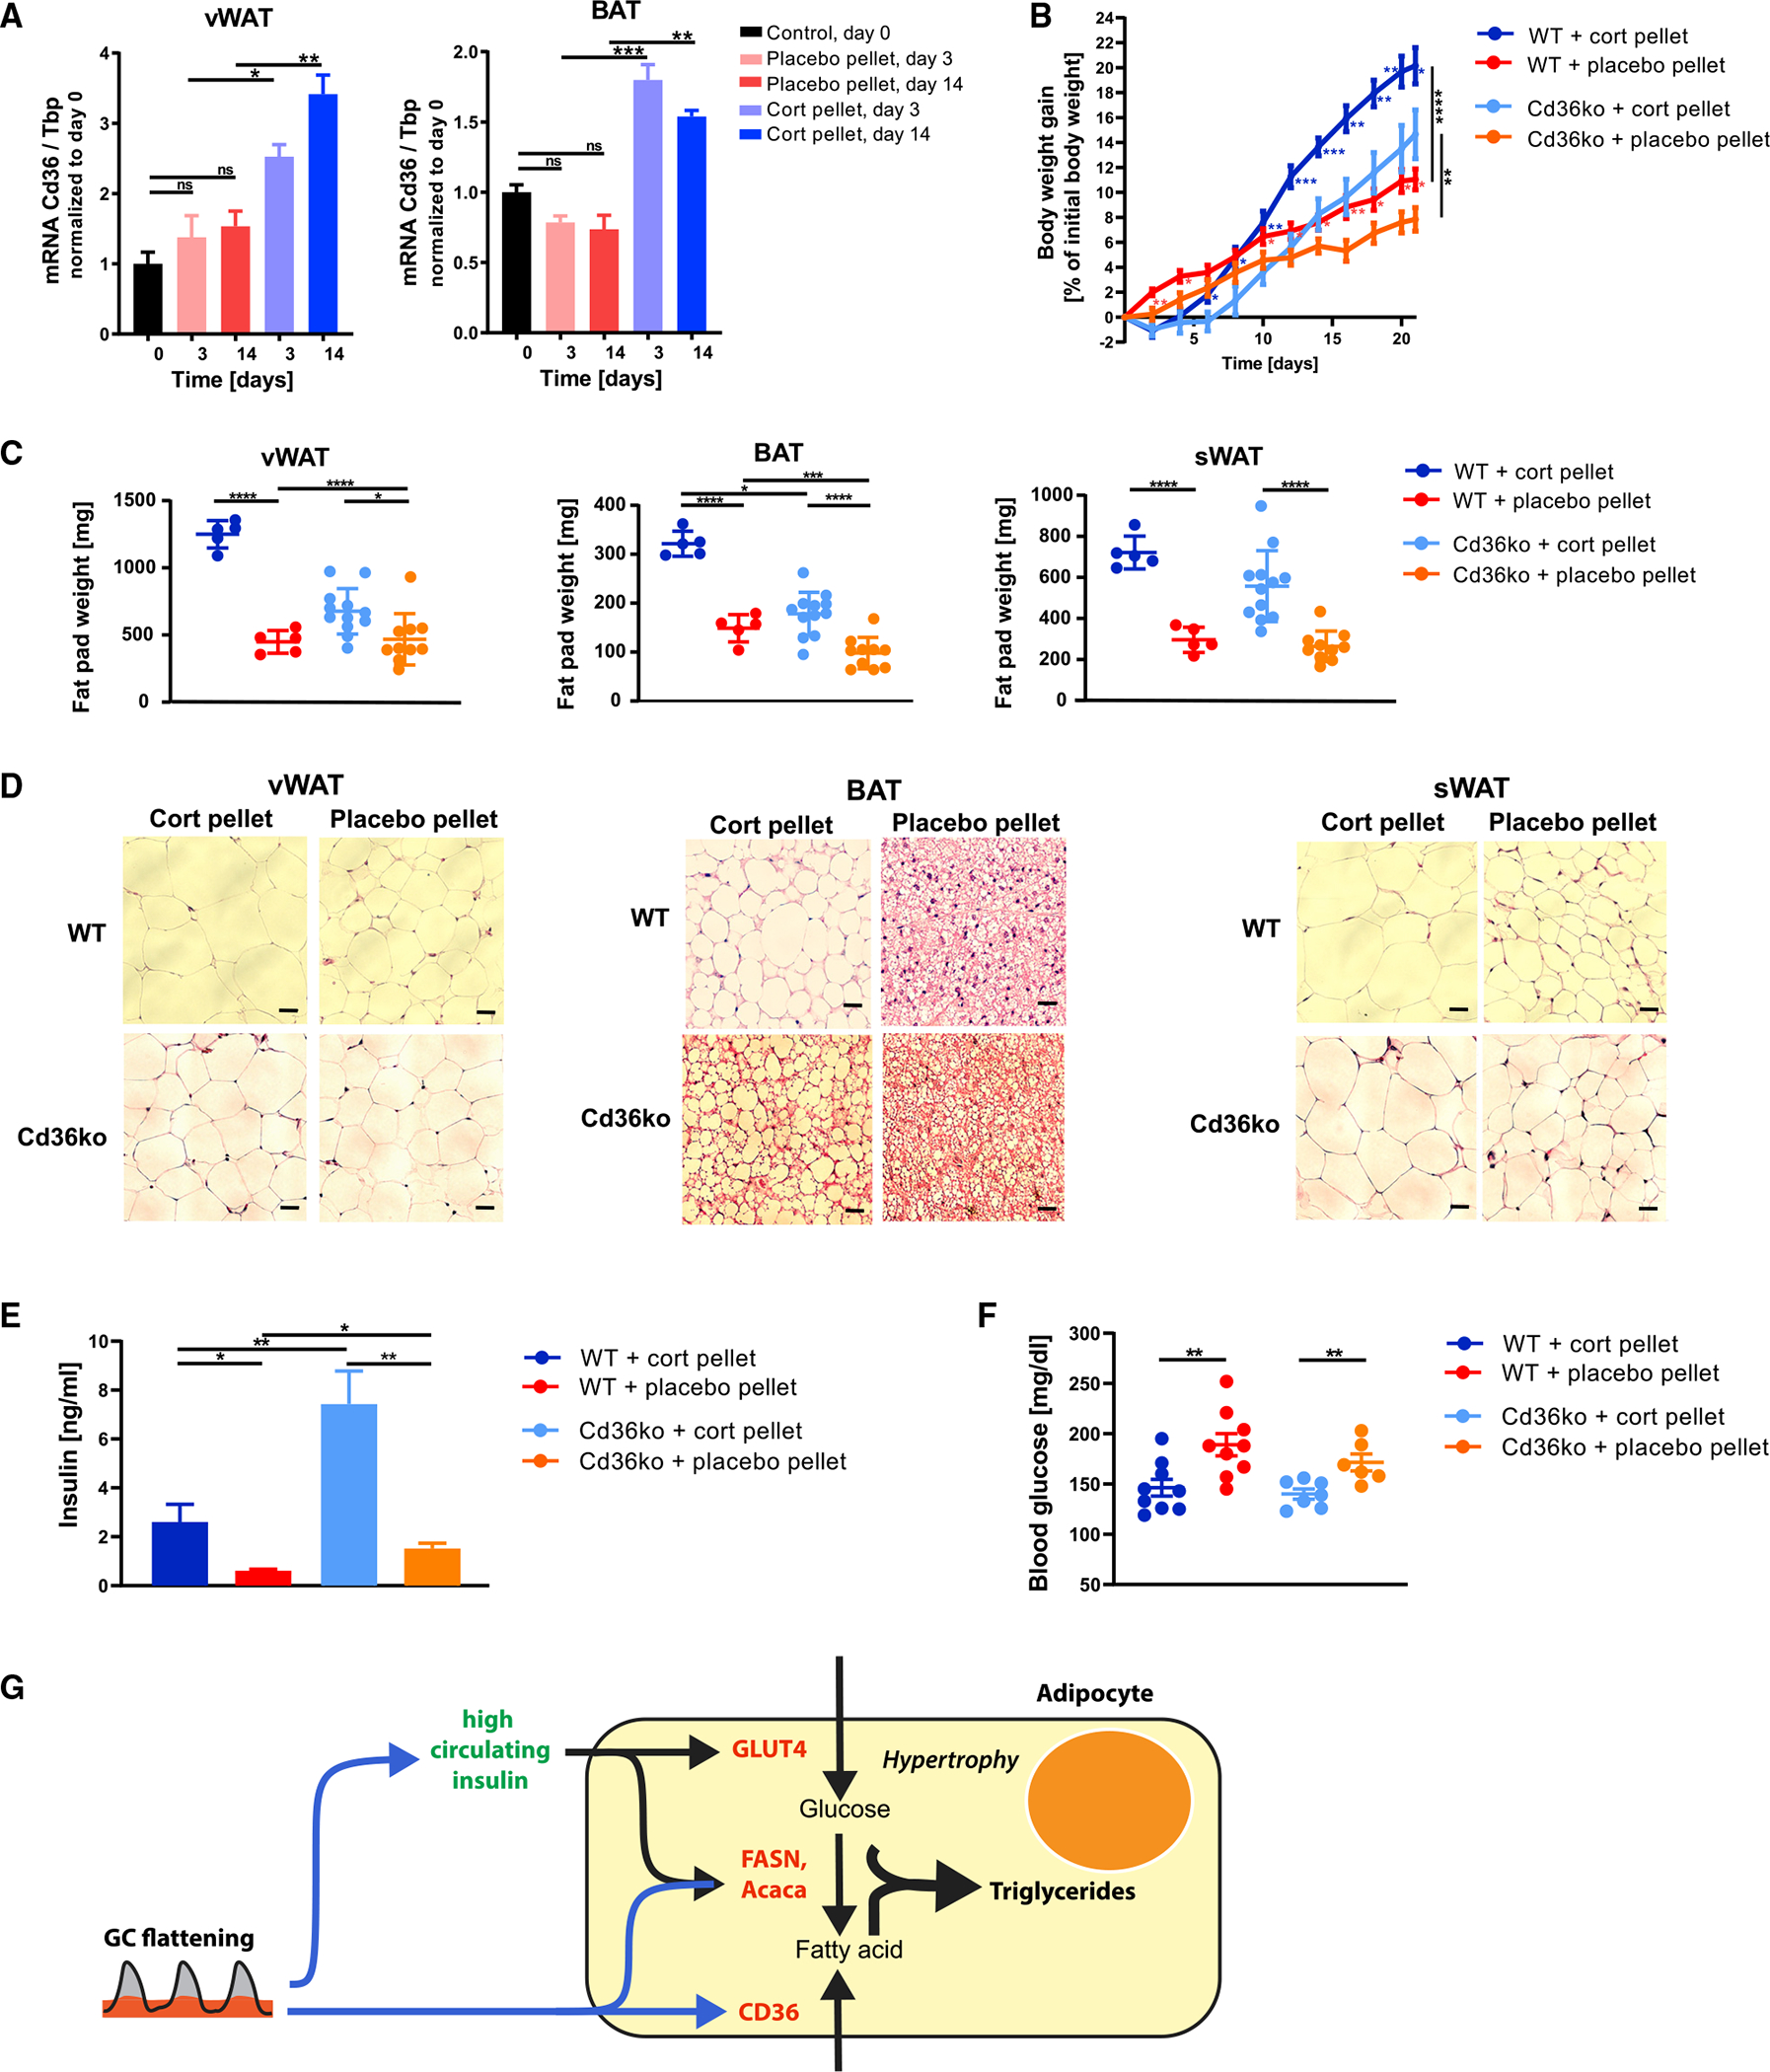
Figure 7. Cd36ko partially protects against adipocyte hypertrophy resulting from flattening of glucocorticoid oscillations.

(A) qPCR of vWAT and BAT 3 and 14 days after cort- or placebo-pellet implantation. Data are normalized to the expression of Tbp and are presented as means ± SEMs (n = 3–4). Unpaired t test; *p < 0.05; **p < 0.01; ***p < 0.001; ns, not significant. Control group are mice at start of experiment (day 0).
(B and C) Body weight gain (B) and (C) weight of vWAT, BAT, and sWAT fat depots 21 days after pellet implantation, n = 5–12, means ± SDs. Unpaired t test; *p < 0.05; **p < 0.01; ***p < 0.001; ****p < 0.0001. See also Table S1.
(D) H&E staining of vWAT, BAT, and sWAT 21 days after pellet implantation. One representative staining is shown (n = 3–5). Scale bars, 50 μm. Quantification of lipid droplet size is shown in Figure S7.
(E) Insulin levels in blood plasma in cort- and placebo-pellet-implanted Cd36ko and wild-type mice (not fasted) 14 days after pellet implantation; means ± SEMs; n = 5–7; unpaired t test; *p < 0.05; **p < 0.01.
(F) Blood glucose levels in cort- and placebo-pellet-implanted Cd36ko and wild-type mice (not fasted) 14 days after pellet implantation; means ± SEMs; n = 6–9; unpaired t test; **p < 0.01.
(G) Scheme of how an initially protective adipocyte hypertrophy mechanism can be activated in response to flattening of circadian GC oscillations. GC flattening results in a distinct metabolic signature with high insulin, slightly lower-than-normal glucose, and normal FFA levels in the circulation.
