Fig. 3.
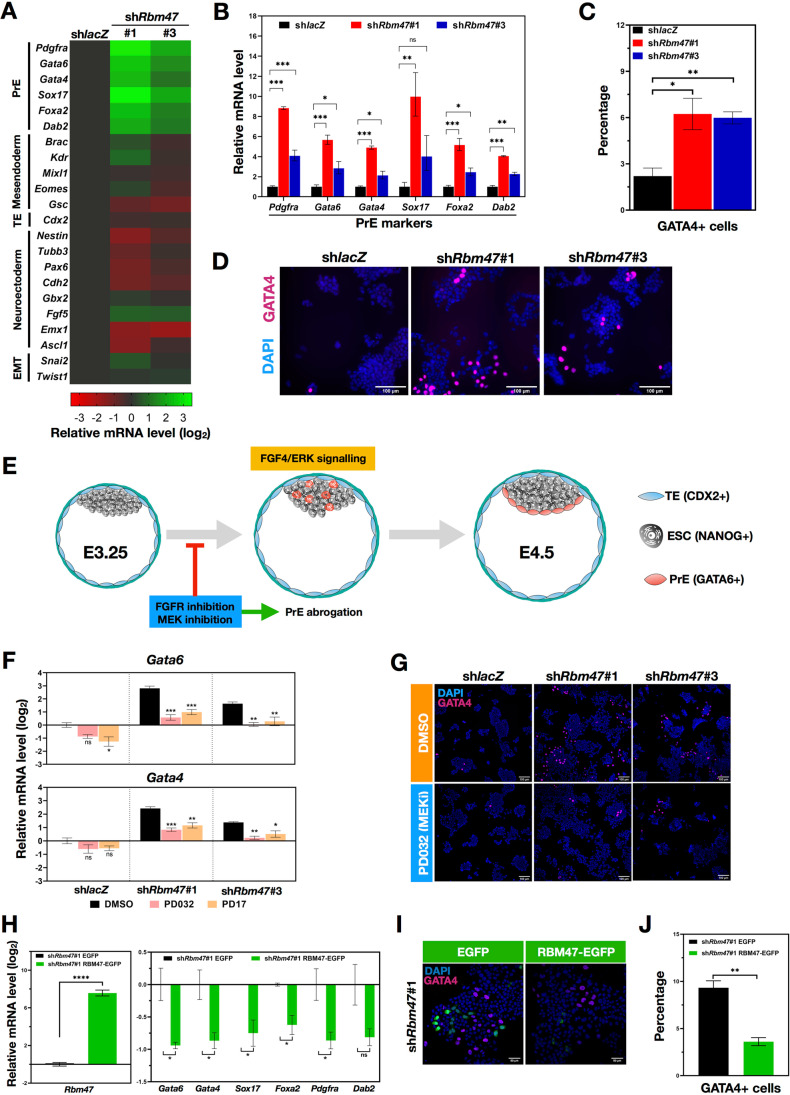
Rbm47 depletion primes mESCs towards a PrE fate which can be reversed by FGF-ERK pathway inhibition or Rbm47 overexpression. A Relative mRNA expression of indicated markers in control and shRbm47 mESCs. Log2 normalized values from three biological replicates were used for heatmap generation. B Relative mRNA levels of PrE markers in linear scale, the plotted values represent mean ± S.E.M. C Quantification of GATA4+ cell population in indicated cultures using cell counter plugin of ImageJ software. Mean cell percentage ± S.E.M were plotted by analyzing images from three immunostaining experiments with > 1000 nuclei (DAPI) analyzed per experiment. D Widefield fluorescence images of mESCs immunostained for GATA4 (Scale-100 μm). E Schematic representation of the development of early blastocyst to late blastocyst. Autocrine FGF4-ERK signaling is majorly responsible for the salt-pepper distribution of NANOG+ Epi and GATA6+ PrE specification. F Relative mRNA levels of Gata6 and Gata4 in DMSO treated, PD17 (Pan-FGFR inhibitor) treated and PD032 (MEK1/2 inhibitor) treated control and Rbm47 knockdown mESCs (48 h treatment) from three independent experiments. Error bars indicate S.E.M. Values were normalized to DMSO treated shlacZ mESCs. G Immunostaining of GATA4 in DMSO treated and inhibitor-treated mESCs (Scale-100 μm). H Relative mRNA levels of PrE markers in shRbm47#1 mESCs that were Neon transfected with EGFP control vector and RBM47-EGFP overexpression vector; the plotted values represent mean ± S.E.M from three Neon transfection experiments. I Immunostaining of GATA4 in EGFP and RBM47-EGFP overexpressing shRbm47#1 mESCs (Scale-50 μm). J Quantification of GATA4+ cell population in indicated mESCs using cell counter plugin of ImageJ software. Mean cell percentage ± S.E.M were plotted by analyzing images from three immunostaining experiments with > 1000 nuclei (DAPI) analyzed per experiment. Statistical test used for: B, C, H and J- unpaired student’s t-test; F- ordinary one-way ANOVA followed by Dunnett’s multiple comparison test, DMSO treated cells used as calibrator; ns- non-significant; *p < 0.05; **p < 0.01; ***p < 0.001; ****p < 0.0001

