Figure 2.

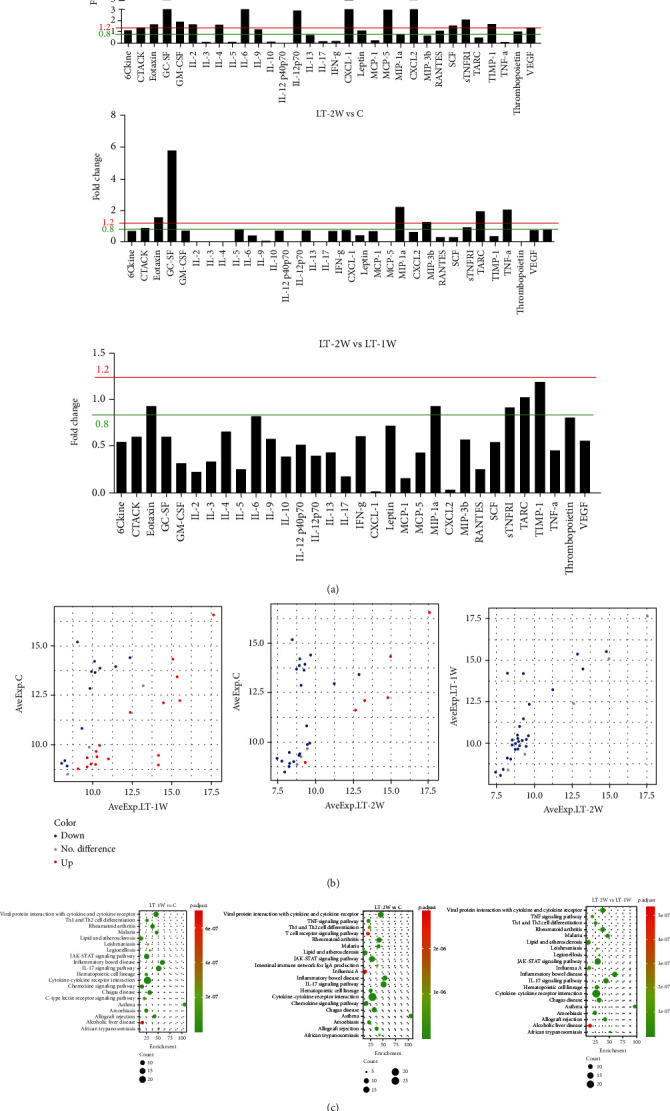
Serum levels of proinflammatory cytokines. (a) Differentially expressed proinflammatory cytokines of mice within each group. (b) Scatter plot of proinflammatory cytokines. (c) KEGG analysis of proinflammatory cytokine functions.

Serum levels of proinflammatory cytokines. (a) Differentially expressed proinflammatory cytokines of mice within each group. (b) Scatter plot of proinflammatory cytokines. (c) KEGG analysis of proinflammatory cytokine functions.