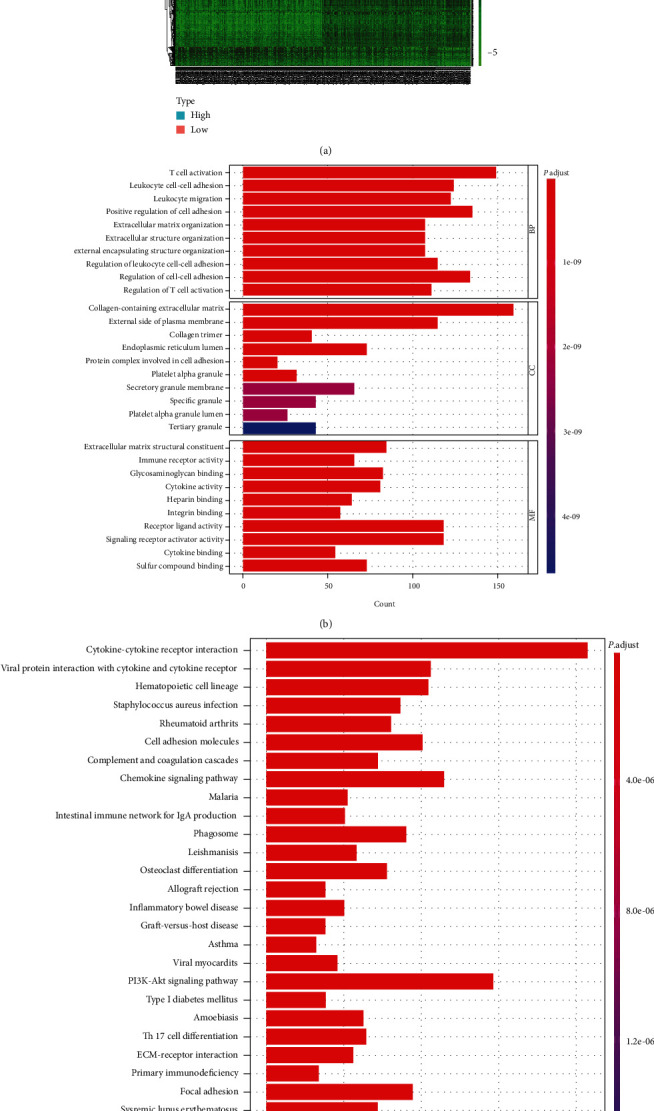
Figure 3.

Heatmap, GO, and KEGG enrichment analysis. (a) DEG heatmap generated by comparing high and low subgroups of stromal score. The row names of the heatmap are the gene names, and the column names are sample IDs. The Wilcoxon rank-sum test was conducted to determine DEGs, and FDR < 0.05 and ∣log2FC | >1 were considered significant. (b, c) GO and KEGG enrichment analyses of 1823 differential genes, of which result with p < 0.05 and q < 0.05, were considered significant.
