
Figure 4.
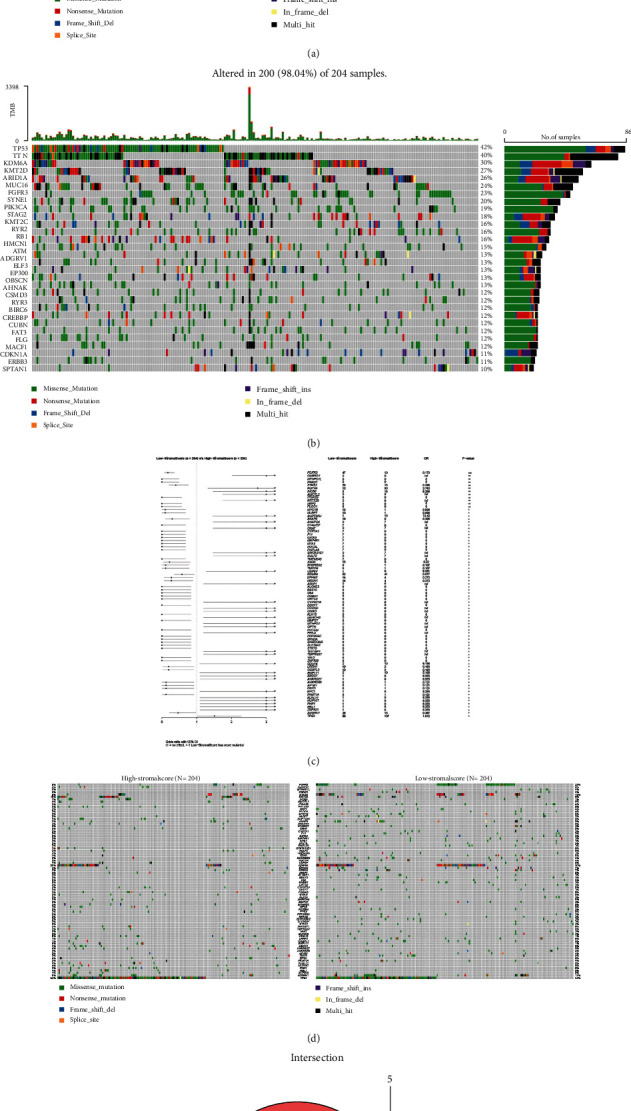
Analysis of somatic mutations between the two immunity groups and identification of common genes in DEGs and DMGs. (a, b) Waterfall plots showing the distribution of the top 30 most frequently mutated genes. (c) Forest plot showing significantly differentially mutated genes between the two cohorts with ∗∗∗p < 0.001, ∗∗p < 0.01, and ∗p < 0.05. (d) Waterfall plot showing 80 DMGs between the high- and low-immunity groups. (e) Venn diagram showing the intersecting genes between DEGs and DMGs.