
Figure 5.
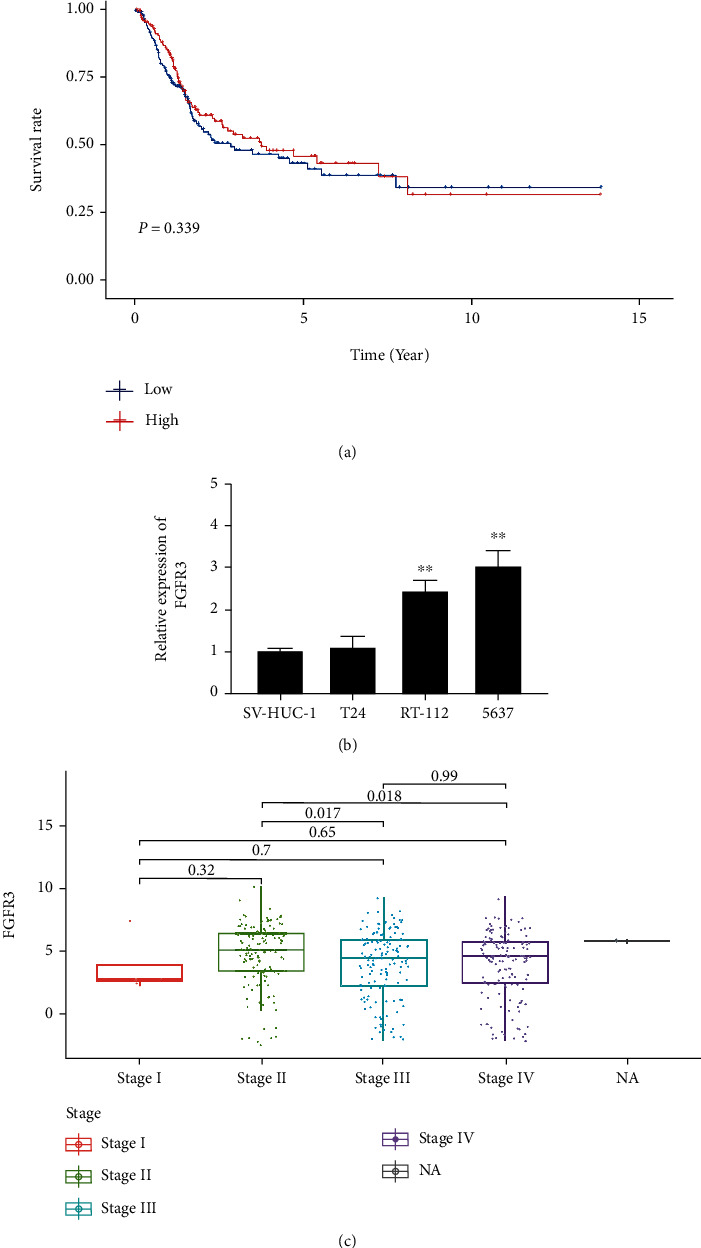
Differential expression of FGFR3 and its correlation with survival time and clinicopathological characteristics of bladder cancer. (a) Survival analysis of bladder cancer patients with different FGFR3 expression levels. Patients were classified into groups with high or low FGFR3 expression levels by comparing the median FGFR3 expression level. It was tested by a rank-sum test with p = 0.339. (b) FGFR3 with high expression in RT-112 and 5637 cells. ∗∗p < 0.01 vs. SV-HUC-1. (c) Correlation of FGFR3 expression with clinicopathological features. The Kruskal-Wallis rank-sum test was used for statistical significance testing.