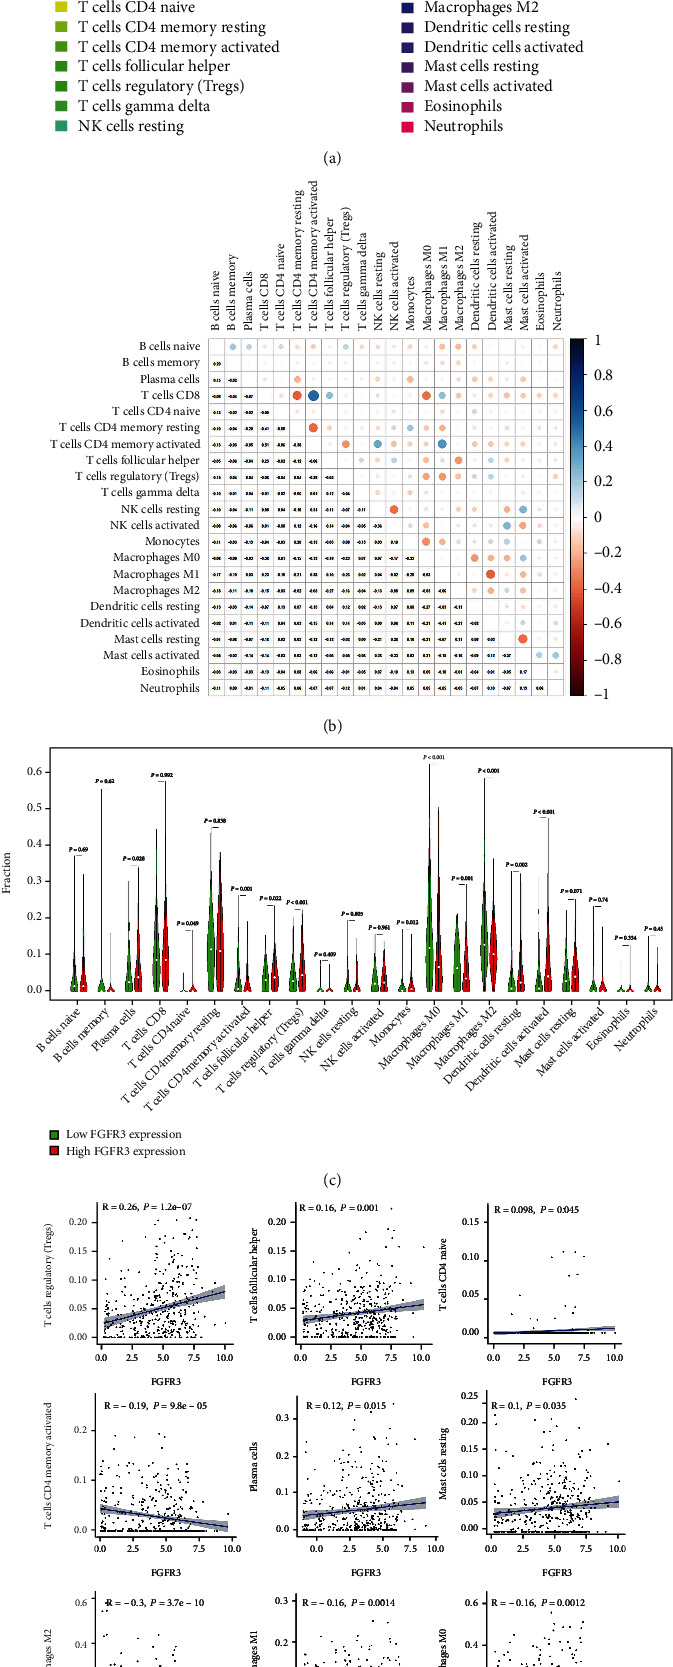
Figure 7.

Relationship between FGFR3 and immune cell infiltration. (a) The proportion of infiltrated immune cells in bladder cancer patients; (b) heatmap of the correlation between immune cells; (c) changes in the median ratio of 22 infiltrated immune cells in bladder cancer samples from the high FGFR3 expression group and low FGFR3 expression group; (d) the association between the variation trend of the proportion of 11 kinds of immune cells and FGFR3 expression.
