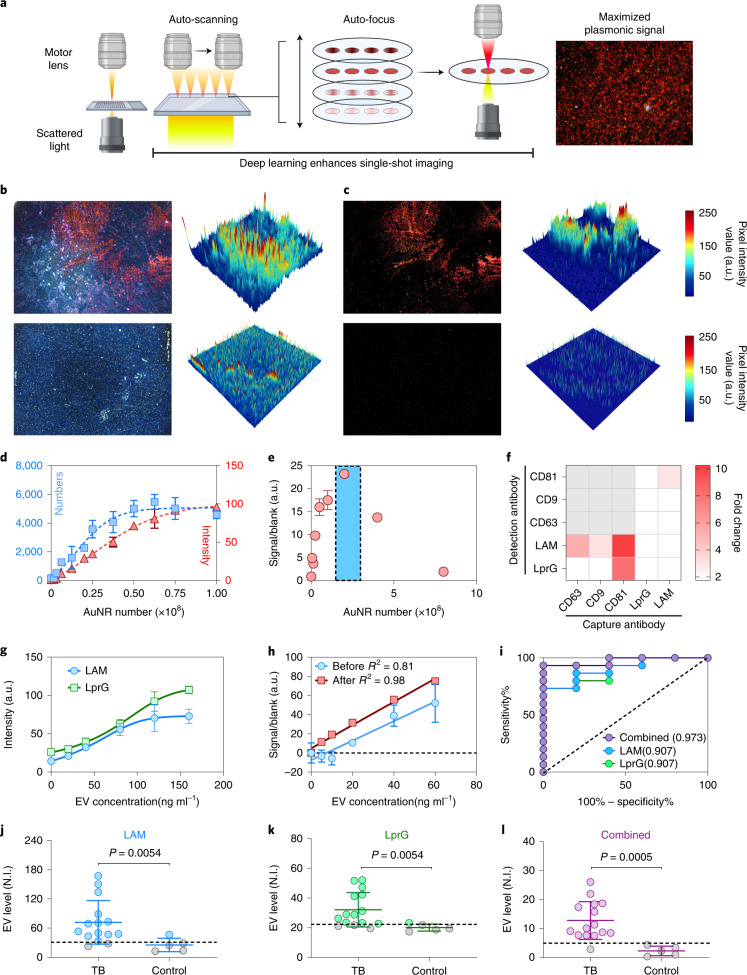
Fig. 2. NEI optimization for sensitive detection of EV-associated TB biomarkers.
a, Schematic of the NEI image capture workflow and signal. Created with BioRender.com. b,c, NEI images (left) and 3D heat maps (right) before (b) and after (c) image processing to remove artefacts (blue and white signal) to improve detection of AuNRs (red signal) bound to Mtb EVs (top) and negative control EVs (bottom). d, Standard curves for AuNR dilutions quantified by counting positive pixels versus mean pixel intensity. e, AuNR titration to maximize signal-to-noise (highlighted in blue shadow) in samples near the EV-ELISA limit of detection (150 ng EV protein per ml). f, NEI signal increase versus background (signal-to-noise) when using the indicated capture and detection antibody pairs to detect NEI signal from a low-concentration EV sample (150 ng protein per ml) and a negative control (blank) sample. g, EV LAM and LprG NEI signal linearity with an Mtb EV concentration curve generated using EVs from Mtb-infected macrophages. h, Linear regression line and correlation coefficient of NEI EV LAM signal without and after noise reduction in background-normalized serum samples spiked with EVs isolated from Mtb-infected macrophages. For d–h: mean ± s.d.; N = 3. i, Receiver operating characteristic (ROC) analysis for the ability of single and integrated (combined) EV LAM and LprG NEI signals to distinguish children with and without TB, indicating areas under the ROC curve. j–l, NEI signal for LAM (j), LprG (k) and integrated LAM and LprG (l) expression on serum EVs of children with TB (N = 15) and with no evidence of TB (N = 5), N.I., NEI signal intensity (arbitrary units; a.u.). Solid lines indicate mean ± s.d.; dashed lines indicate the threshold for positive signal determined in corresponding ROC analysis in i. P values were determined by two-sided Mann-Whitney U test.

