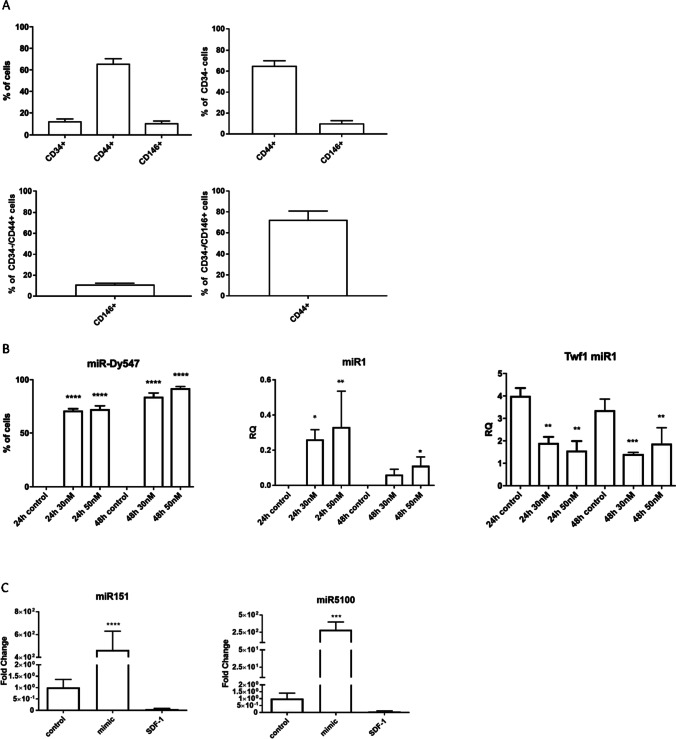
Figure 1.
Mouse BMSCs markers and transfection efficiency. (A) Proportion of CD34+, CD44+, and CD146+ cells in the whole cell population obtained from mouse femur and tibia bones. The proportion of CD44+ and CD146+ within CD34- subpopulation. The proportion CD146+ within CD34-/CD44+ subpopulation and CD44+ cells within CD34-/CD146+ subpopulation. (B) Proportion of cells with fluorescent miR-Dy547 present in their cytoplasm after transfection with 30nM or 50nM of miR-Dy547 for 24h or 48h. Expression level of miR1 after transfection with 30nM or 50nM of miR1 mimic for 24h or 48h. Expression levels of miR1 direct target – Twf1 in control or miR1 mimic transfected mouse BMSCs. (C) Expression levels of miR151 and miR5100 in controls, transfected or treated with SDF-1 mouse BMSCs. The differences were considered statistically significant when p < 0.05 (marked with asterisks, * - p < 0.05; ** - p < 0.005; *** - p < 0.001; **** - p < 0.0001)

