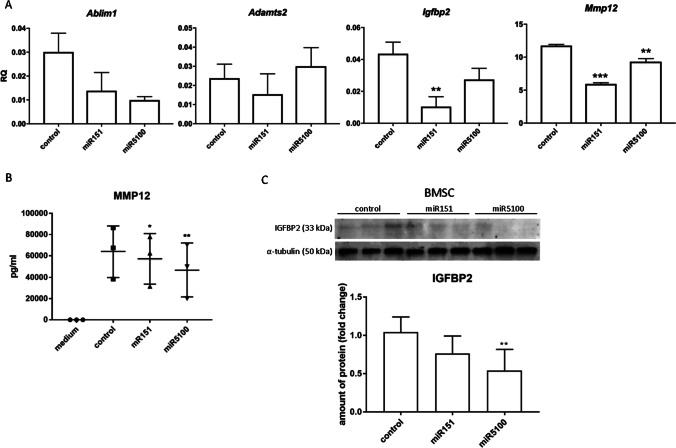
Figure 4.
Analysis of selected transcripts and protein levels in miR151 or miR5100 transfected mouse BMSCs. (A) Gene expression levels of selected genes in control or miR151 or miR5100 transfected mouse BMSCs. (B) ELISA analysis of MMP12 amount in medium from in vitro cultures of control or transfected mouse BMSCs. (C) The level of IGFBP2 in control or transfected BMSCs. The differences were considered statistically significant when p < 0.05 (marked with asterisks, * - p < 0.05; ** - p < 0.005; *** - p < 0.001)

