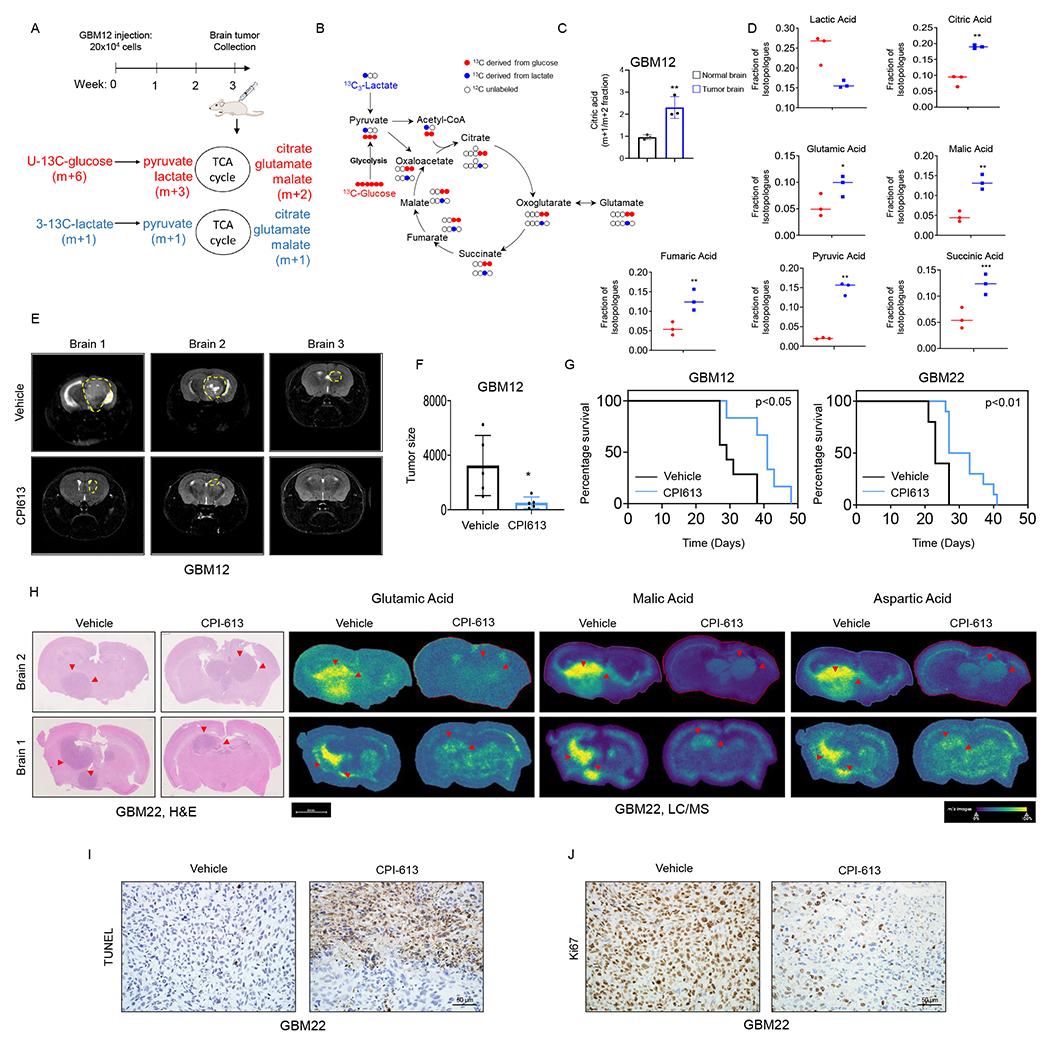
Figure 4. Lactate predominantly labels the TCA-cycle in orthotopic PDX models in mice and pharmacological targeting of the TCA-cycle extends animal survival.

(A) Schematic representation of the intracranial model of glioblastoma. GBM cells were implanted into the right striatum of nude mice for three weeks. An equal amount of both 3-13C-labelled lactate (m+1) and U-13C-labelled glucose (m+6) were injected i.p 30 min prior to brain tumor collection.
(B) Shown is the U-13C-glucose carbons (red) and 3-13C-lactate carbons (blue) and how they are transferred among molecules of the TCA cycle. Glucose is metabolized to pyruvic acid labelling three carbons, while lactate is metabolized to pyruvic acid labelling just one carbon. Glucose derived carbons label the TCA cycle metabolites in a (m + 2) pattern, while lactate labelling occurs in (m+1).
(C) GBM12 cells were implanted into the right striatum of Nu/Nu mice for three weeks. An equal amount of both 3-13C-labelled lactate (m+1) and U-13C-labelled glucose (m+6) were injected i.p 30 min prior to brain tumor collection for LC/MS analysis.
(D) Shown are the levels of TCA cycle-intermediates isotopologue m+1 (derived from lactate, blue dot graph) and TCA cycle-intermediates isotopologue m+2 (derived from glucose, red dot graphs).
(E, F) Two groups of mice implanted with GBM12 cells were randomly assigned: vehicle and CPI613 (50mg/kg) treatment was initiated after seven days of the implantation. Mice were treated four times per week by i.p. injection. Shown is the tumor size of representative MRI images using a Bruker BioSpecTM, 9.4 Tesla MR Imager. The quantification is shown in (F) (n=5).
(G) GBM cells were implanted into the right striatum of Nu/Nu mice and treated with vehicle or CPI613 (50mg/kg) four times a week to assess tumor growth-related symptoms/survival.
(H) Representative hematoxylin and eosin staining and MALDI-TOF imaging of the brain tissues treated with vehicle or CPI613.
(I, J) TUNEL and Ki67 staining of the vehicle or CPI613 treated GBM22 tumors treatment in (G). Scale bar: 50μm.
Statistical significance was assessed by a two-tailed student’s t-test. Kaplan–Meier curves of animal’s survival are provided and the log-rank test was used to assess statistical significance. Data are shown as mean ± SD. *p<0.05, **p<0.01. See also Figure S5.
