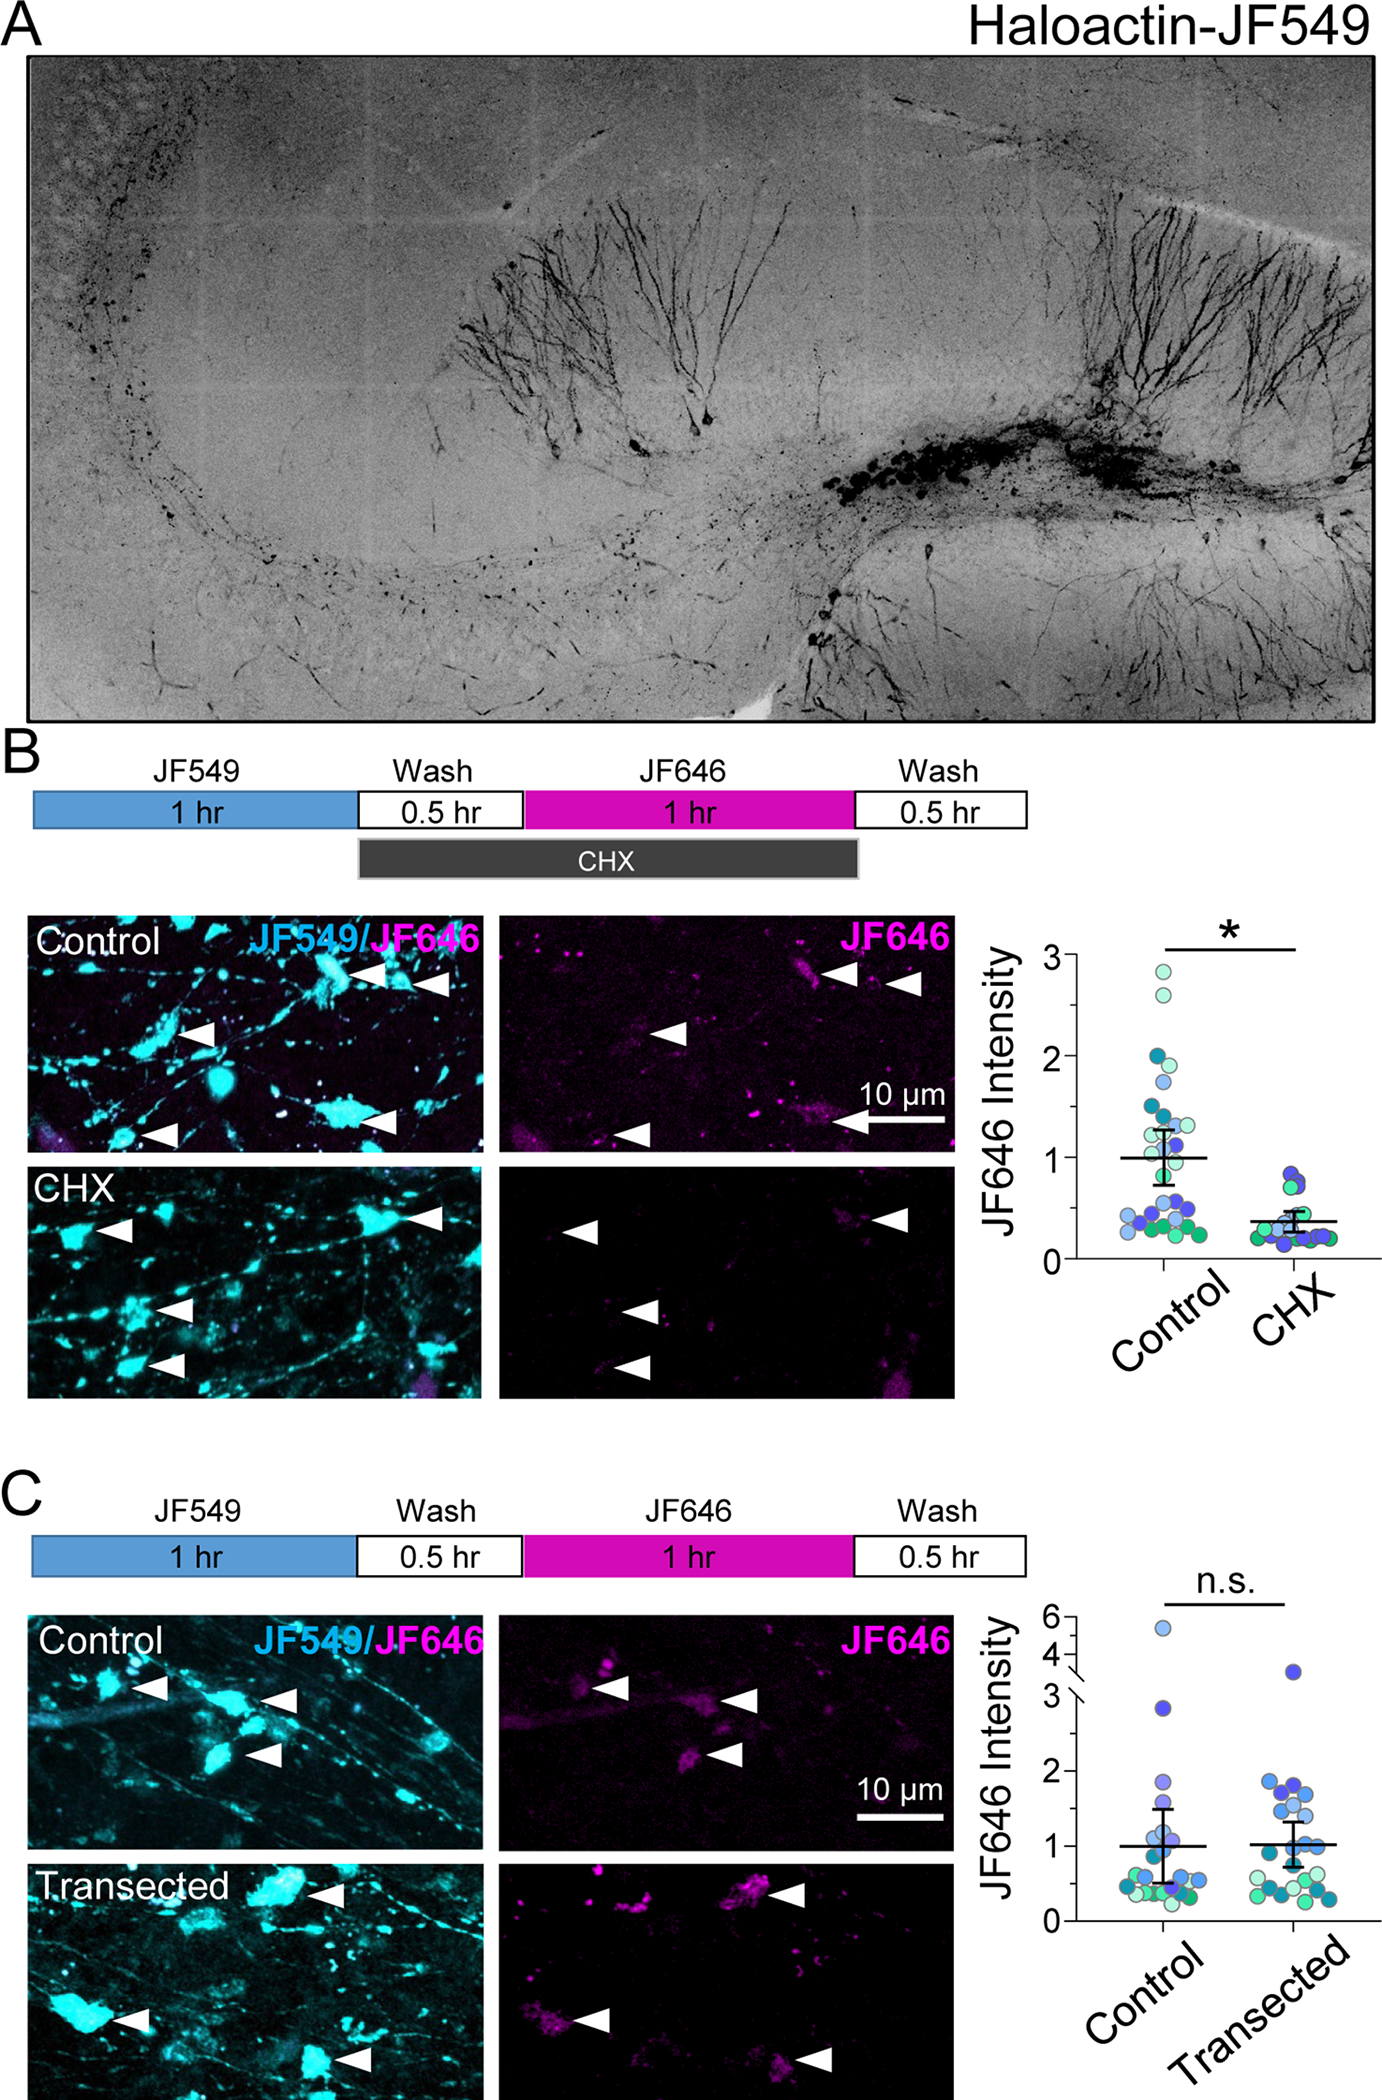
Figure 1. MFs synthesize protein locally.

A. Representative tiled fluorescence image of a hippocampal slice expressing Halo-actin labeled with JF549 HaloTag ligand after targeted stereotactic injection in dentate gyrus.
B. CHX bath application blocks labeling of newly synthesized Halo-actin (JF646) in individual MF boutons. (Top) Timeline of Halo-actin pulse-chase experiment. (Bottom left) Representative images of JF549/JF646 (cyan/magenta) labeled Halo-actin in mossy fiber boutons (arrowheads) from Control or CHX-treated slices. (Bottom right) Control: 1.00 ± 0.17 vs. CHX: 0.36 ± 0.06 (Mean ± S.E.M. of slices), Mann-Whitney, U = 1, p = 0.03; n = 29, 20 boutons; 5, 4 slices respectively; 4 animals.
C. Transected mossy fiber axons synthesized β-actin protein at the same levels as intact control axons. (Top) Timeline of Halo-actin pulse-chase experiment. (Bottom left) Representative images of JF549/JF646 (cyan/magenta) labeled Halo-actin in mossy fiber boutons (arrowheads) from control or transected slices. (Bottom right) Control: 1.01 ± 0.28 vs. transected: 0.99 ± 0.26 (Mean ± S.E.M. of slices), Mann-Whitney, U = 28, p > 0.999; n = 23 boutons, 8, 7 slices respectively; 4 animals.
N = slices. Black line and bar represent the mean ± 95% confidence interval of boutons. Points representing individual boutons are color-coded by slice and normalized to mean of Control.
See also Supp. Figure 1.
n.s. = p>0.05; *p≤0.05; **p≤0.01; ***p≤0.001; ****p≤0.0001.
