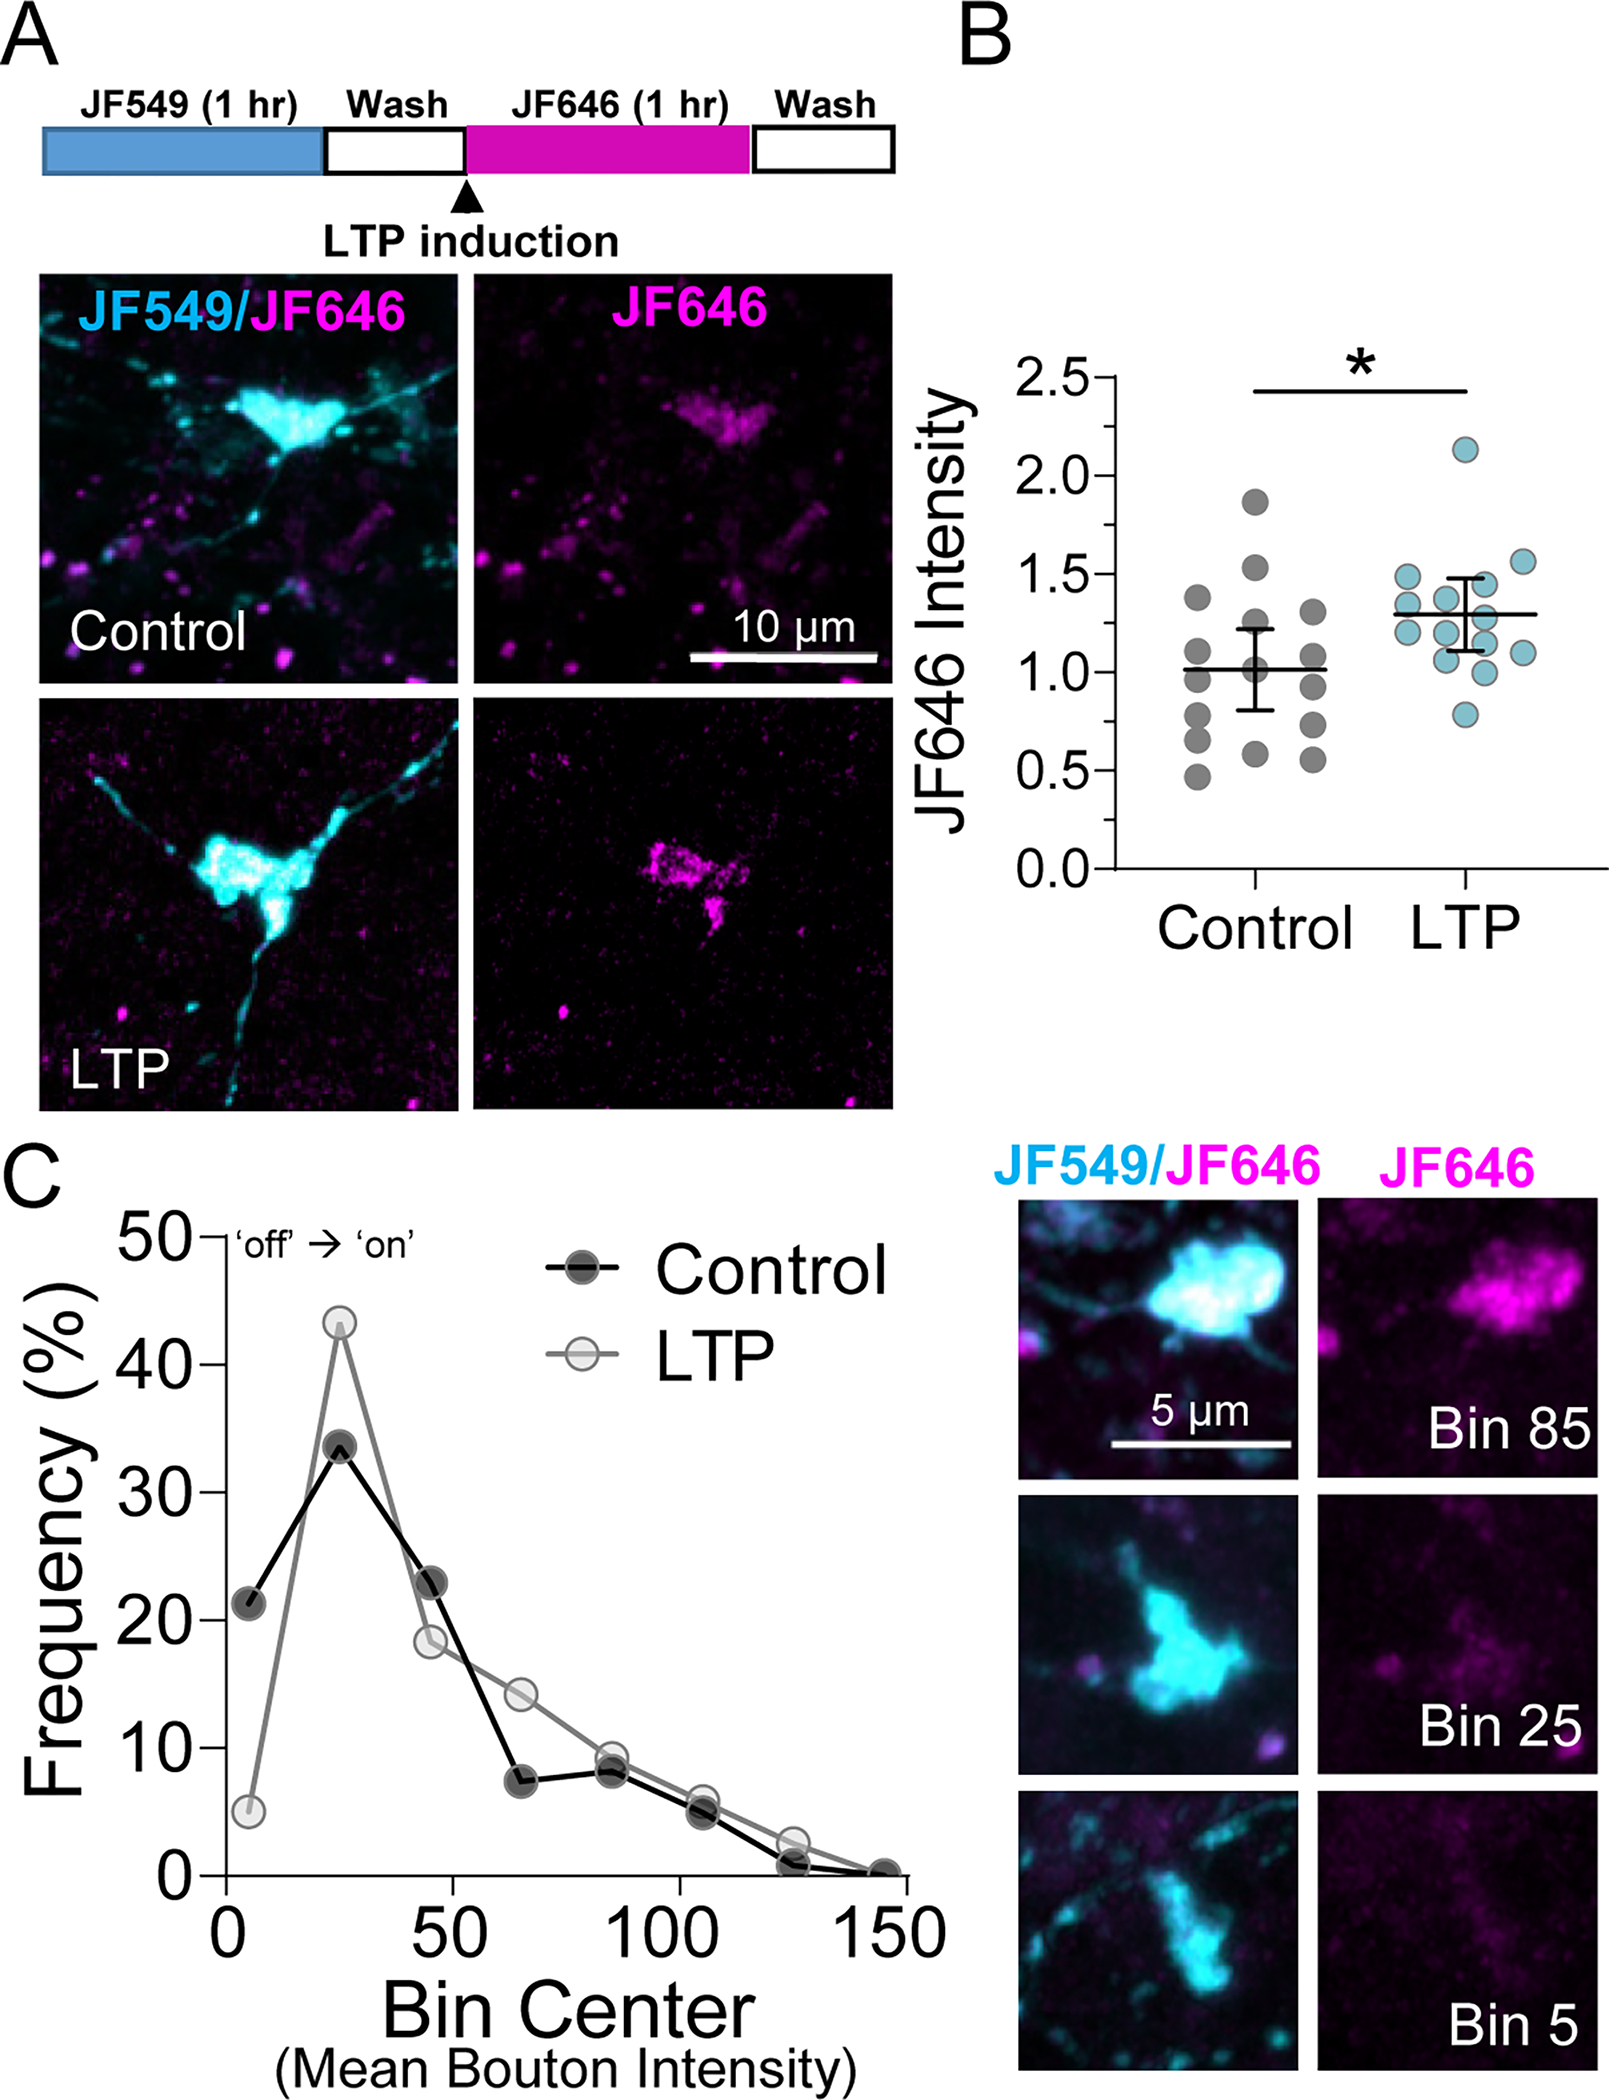
Figure 4. LTP induction elicits changes in local actin synthesis in MF tract.

A. (Top) Timeline of Halo-actin LTP experiment. (Bottom) Representative images of pulse-chase labeled mossy fiber boutons in Halo-actin injected slices from CTRL v. LTP slices.
B. MF-LTP increased newly synthesized Halo-actin in individual MF boutons CTRL: 1.0 ± 0.10 v. LTP: 1.29 ± 0.09 (Mean ± S.E.M. of slices); Unpaired t-test, p = 0.04, n = 122, 120 boutons 16,14 slices respectively, 8 animals. Black line and bar represent the mean ± 95 % confidence interval of slices. Points representing average bouton intensity per slice are normalized to mean of Control.
C. (Left) Relative frequency (%) histogram of bouton intensity values indicated LTP primarily impacts low intensity boutons, shifting translationally quiescent boutons (i.e. Bin Center 5) to a translationally active state (i.e. Bin Center ≥ 25), KS test, p = 0.04, n = 122, 120 boutons 16,14 slices respectively, 8 animals. (Right) Representative boutons from indicated Bins corresponding to histogram on left.
N = slices.
n.s. = p>0.05; *p≤0.05; **p≤0.01; ***p≤0.001; ****p≤0.0001.
