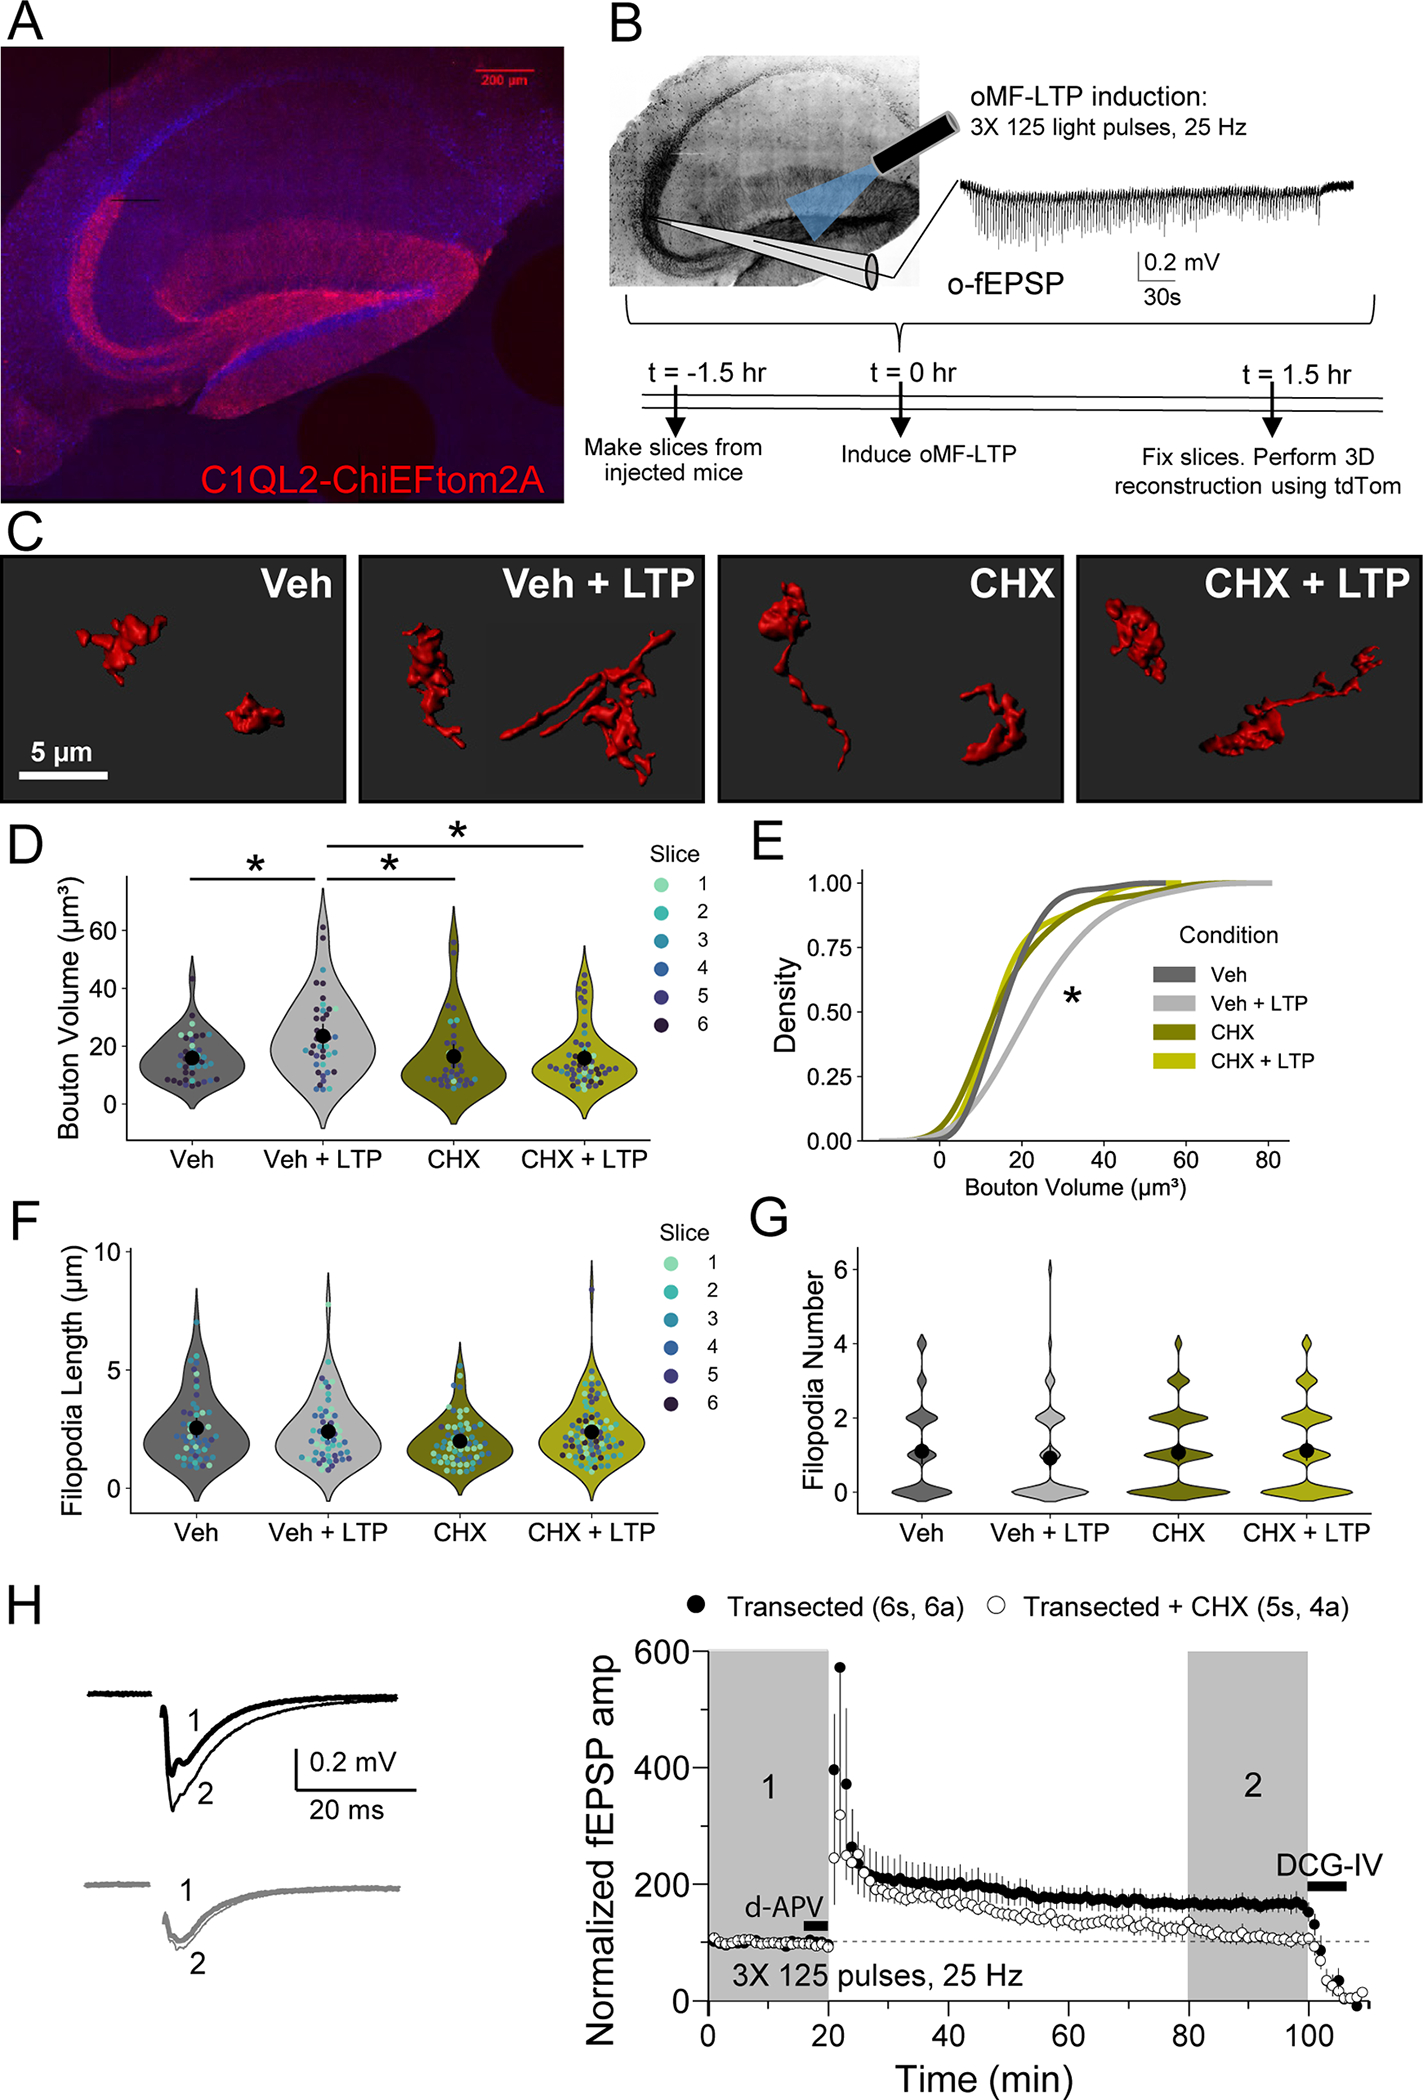
Figure 5. Structural and functional plasticity of MFBs requires protein synthesis.

A. Representative tiled image of acute hippocampal slice from WT C57 mice injected with C1QL2-ChiEFtom2A-GFP.
B. Representative optogenetically-induced, extracellular field excitatory postsynaptic potentials (o-fEPSPs) recorded in CA3 resulting from optogenetic light activation (470 nm) in the hilus of slices from A. using MF-LTP induction protocol (125 pulses, 25 Hz, 3×).
C. Representative 3D reconstructions of giant MFBs from slices in A.
D. Quantification of MFB volume (μm3) from 3D reconstructions revealed MF-LTP significantly increased bouton volume 1 hour post-LTP. This increase was blocked by bath application of protein synthesis inhibitor, cycloheximide (CHX, 80 μM). Veh: 14.24 ± 1.34 v. Veh + LTP: 24.31 ± 2.09 v. CHX: 14.84 ± 3.94 v. CHX + LTP: 13.91 ± 1.30; Two-Way ANOVA with Tukey’s test for Multiple Comparisons F[1,19] = 5.82, p = 0.024, n = 41, 41, 36, 54 boutons respectively, 6 slices, 3 animals.
E. LTP induction resulted in significant shift in the distribution of bouton volume when protein synthesis is intact. KS test, Z = 3.11, p < 0.00001.
F. Length of filopodia was not altered by LTP induction or blockade of protein synthesis. Veh: 1.10 ± 0.18 v. Veh + LTP: 0.91 ± 0.16 v. CHX: 1.10 ± 0.11 v. CHX + LTP: 1.12 ± 0.14; Two-Way ANOVA with Tukey’s test for Multiple Comparisons F[1,252] = 3.00, p = 0.08, n = 52, 57, 64, 83 filopodia respectively, 6 slices, 3 animals.
G. Number of filopodia per bouton was not altered by LTP induction or blockade of protein synthesis. Veh: 1.10 ± 0.18 v. Veh + LTP: 0.92 ± 0.16 v. CHX: 1.07 ± 0.12 v. CHX + LTP: 1.12 ± 0.14; Two-Way ANOVA with Tukey’s test for Multiple Comparisons F[1,263] = 0.63, p = 0.43, n = 48, 62, 83, 74 boutons respectively, 6 slices, 3 animals.
H. MF-LTP was intact in transected slices, but blocked by bath application of cycloheximide (CHX, 80 μM). Transected: 164.92 ± 13.66 v. transected + CHX: 111.32 ± 11.75; Two sample t-test, p = 0.018, n = 5s, 4a (Transected + CHX) 6s, 6a (Transected).
N = slices. Individual points representing boutons are color-coded by slice. Large black circle and bar represent the mean ± 95 % confidence interval of boutons. See also Supp. Figure 2.
n.s. = p>0.05; *p≤0.05; **p≤0.01; ***p≤0.001; ****p≤0.0001.
