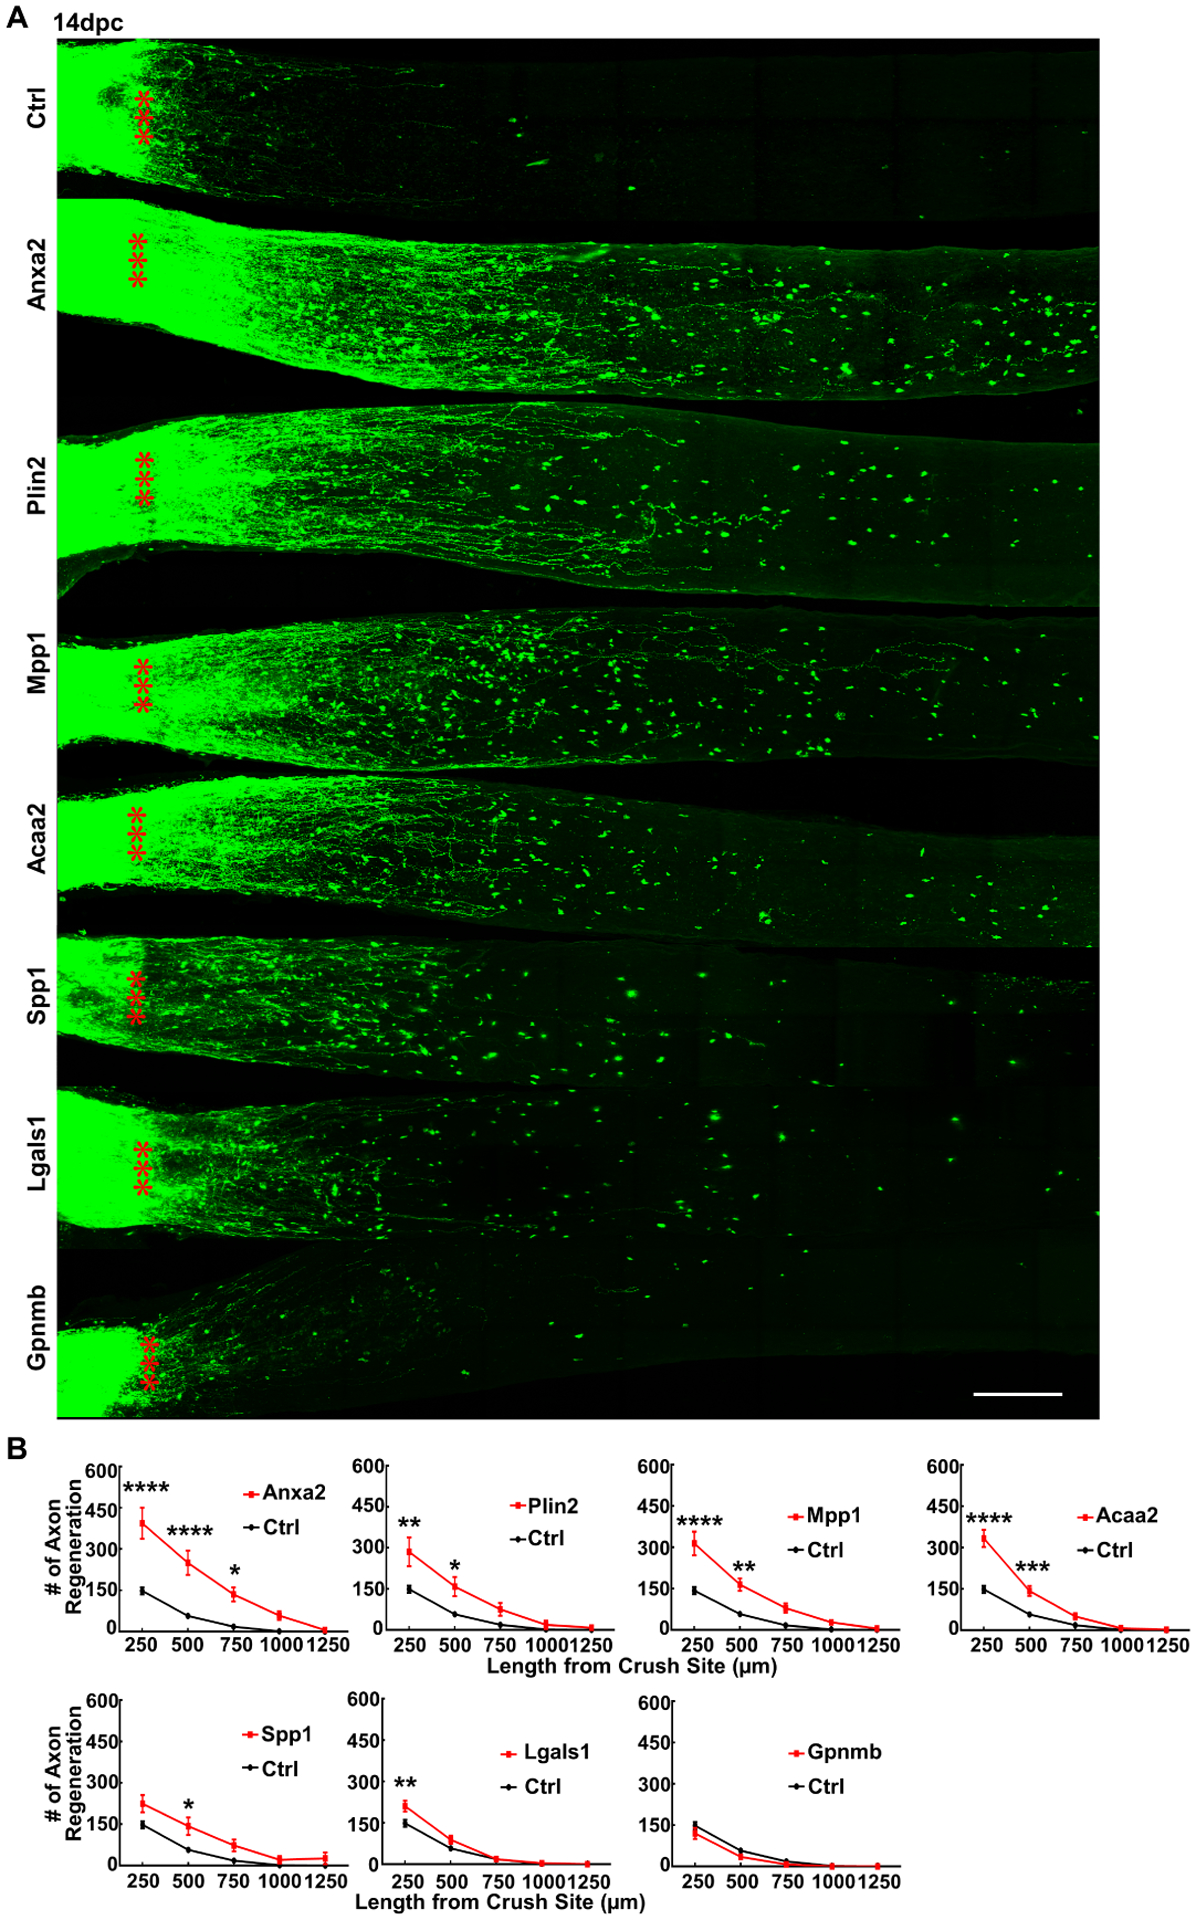
Figure 4. Anxa2 is the most potent of the 6 regeneration-associated genes that promote significant axon regeneration after ONC injury.

(A) Confocal images of optic nerve wholemounts after optical clearance showing maximum intensity projection of regenerating fibers labeled with CTB-Alexa 555 at 14dpc. Scale bar, 100 μm. *: crush site. (B) Quantification of regenerating fibers at different distances distal to the lesion site. Data are presented as means ± s.e.m, n = 8 in all groups except the Acaa2 group (n = 10). *: p<0.05, **: p<0.01, ***: p<0.001, ****: p<0.0001, two-way ANOVA with Sidak’s multiple comparisons test.
See also Figure S5
