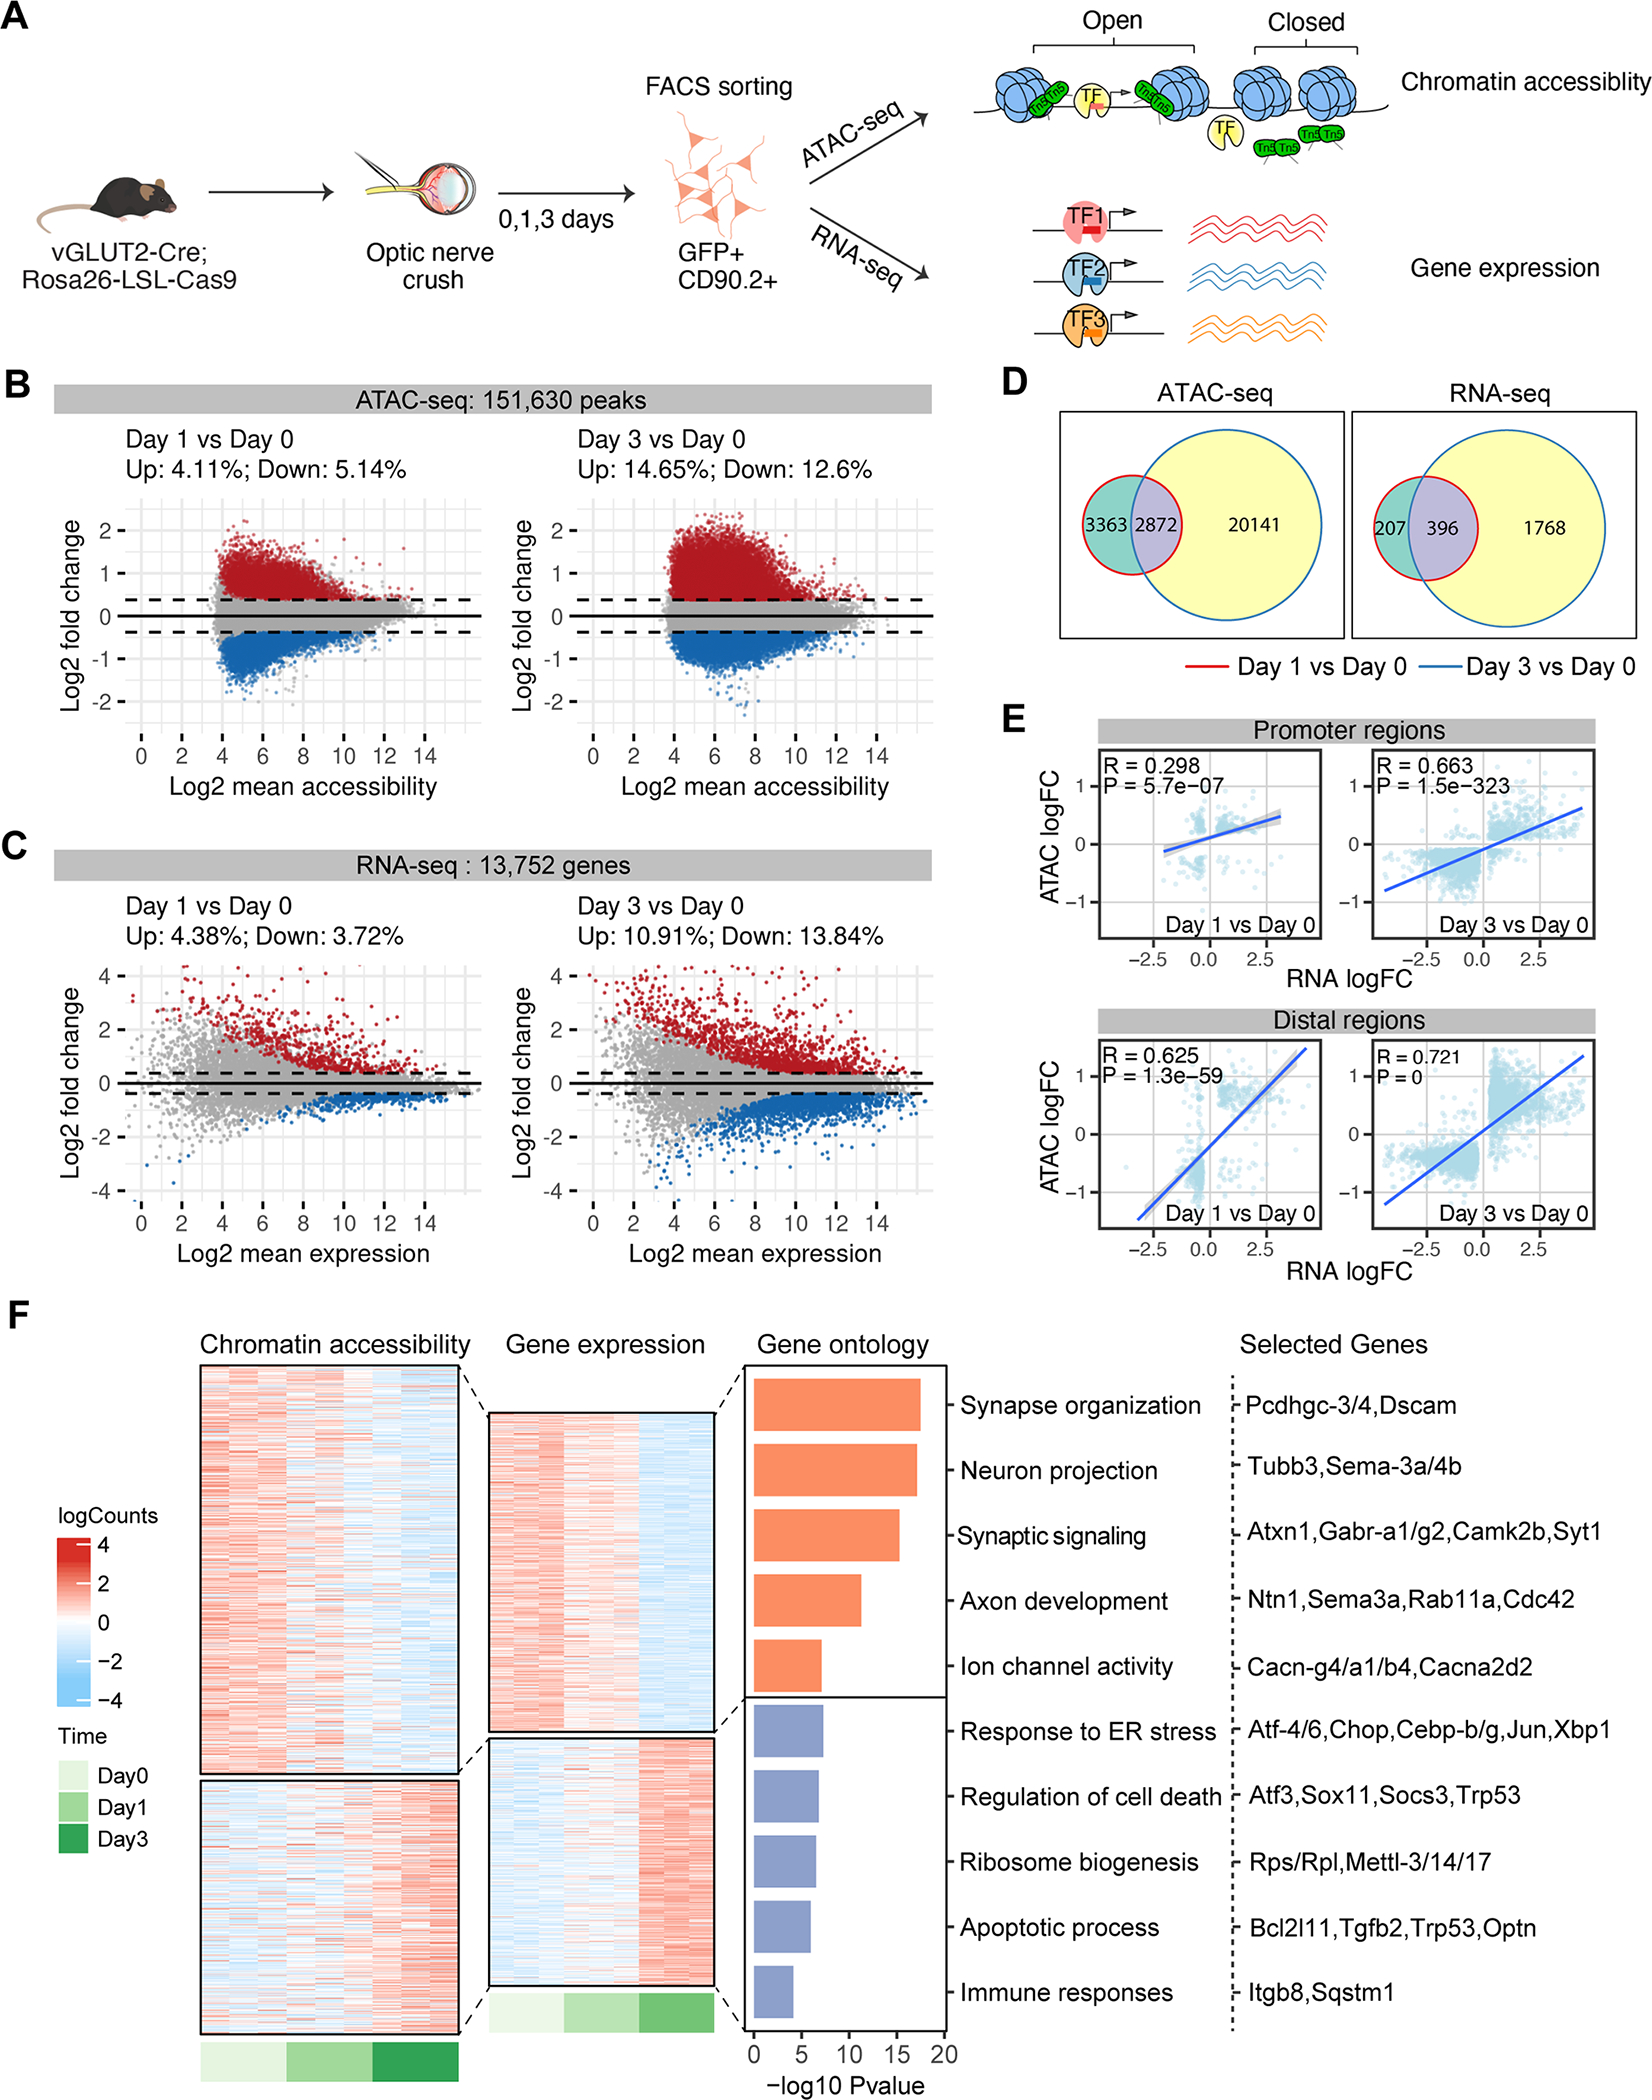
Figure 2. Characterization of chromatin accessibility changes in retinal ganglion cells following optic nerve crush.

(A) Schematic diagram summarizing the overall experimental flow. vGLUT2-labeled RGCs were FACS-sorted at 0 (no crush) 1, 3 days following optic nerve crush. ATAC-seq and RNA-seq were performed on separate sets of injured RGCs, with n = 3–6 biological repeats in each time point.
(B-D) MA plots displaying differential accessible regions (DAR) (B) and differential expressed genes (DEGs) (C) in RGCs following injury. Each dot represents a peak region or a gene, and colored dots indicate DARs or DEGs (FDR p < 0.1, | log2 FC| > 0.3). Upregulated: red; Down-regulated: blue. (D) Overlap of DARs and DEGs at day 1 or day 3 following injury.
(E) Pearson correlations between injury-induced changes in gene expression and chromatin accessibility at the promoter and distal DARs. Using GENCODE annotations, we defined an ATAC-seq peak ± 2 kb of a gene’s transcription start site (TSS) as a promoter (proximal regulatory element), and non-promoter peaks ± 500 kb of TSS as distal regulatory regions of that gene. The differential accessibilities of these DARs (log2 FCs) were correlated and plotted against the differential expression of the linked genes. If several distal peaks are linked to the same gene, the average differential accessibility was used to correlate with differential expression.
(F) Chromatin accessibility and mRNA expression of linked peak-gene pairs. Heatmap colors indicate row-scaled chromatin accessibility (left) or mRNA expression levels (right). Bar plots represent negative log10 FDR-corrected p-values of top Gene Ontology (GO) terms associated with genes in each cluster. Representative genes in each term were displayed.
