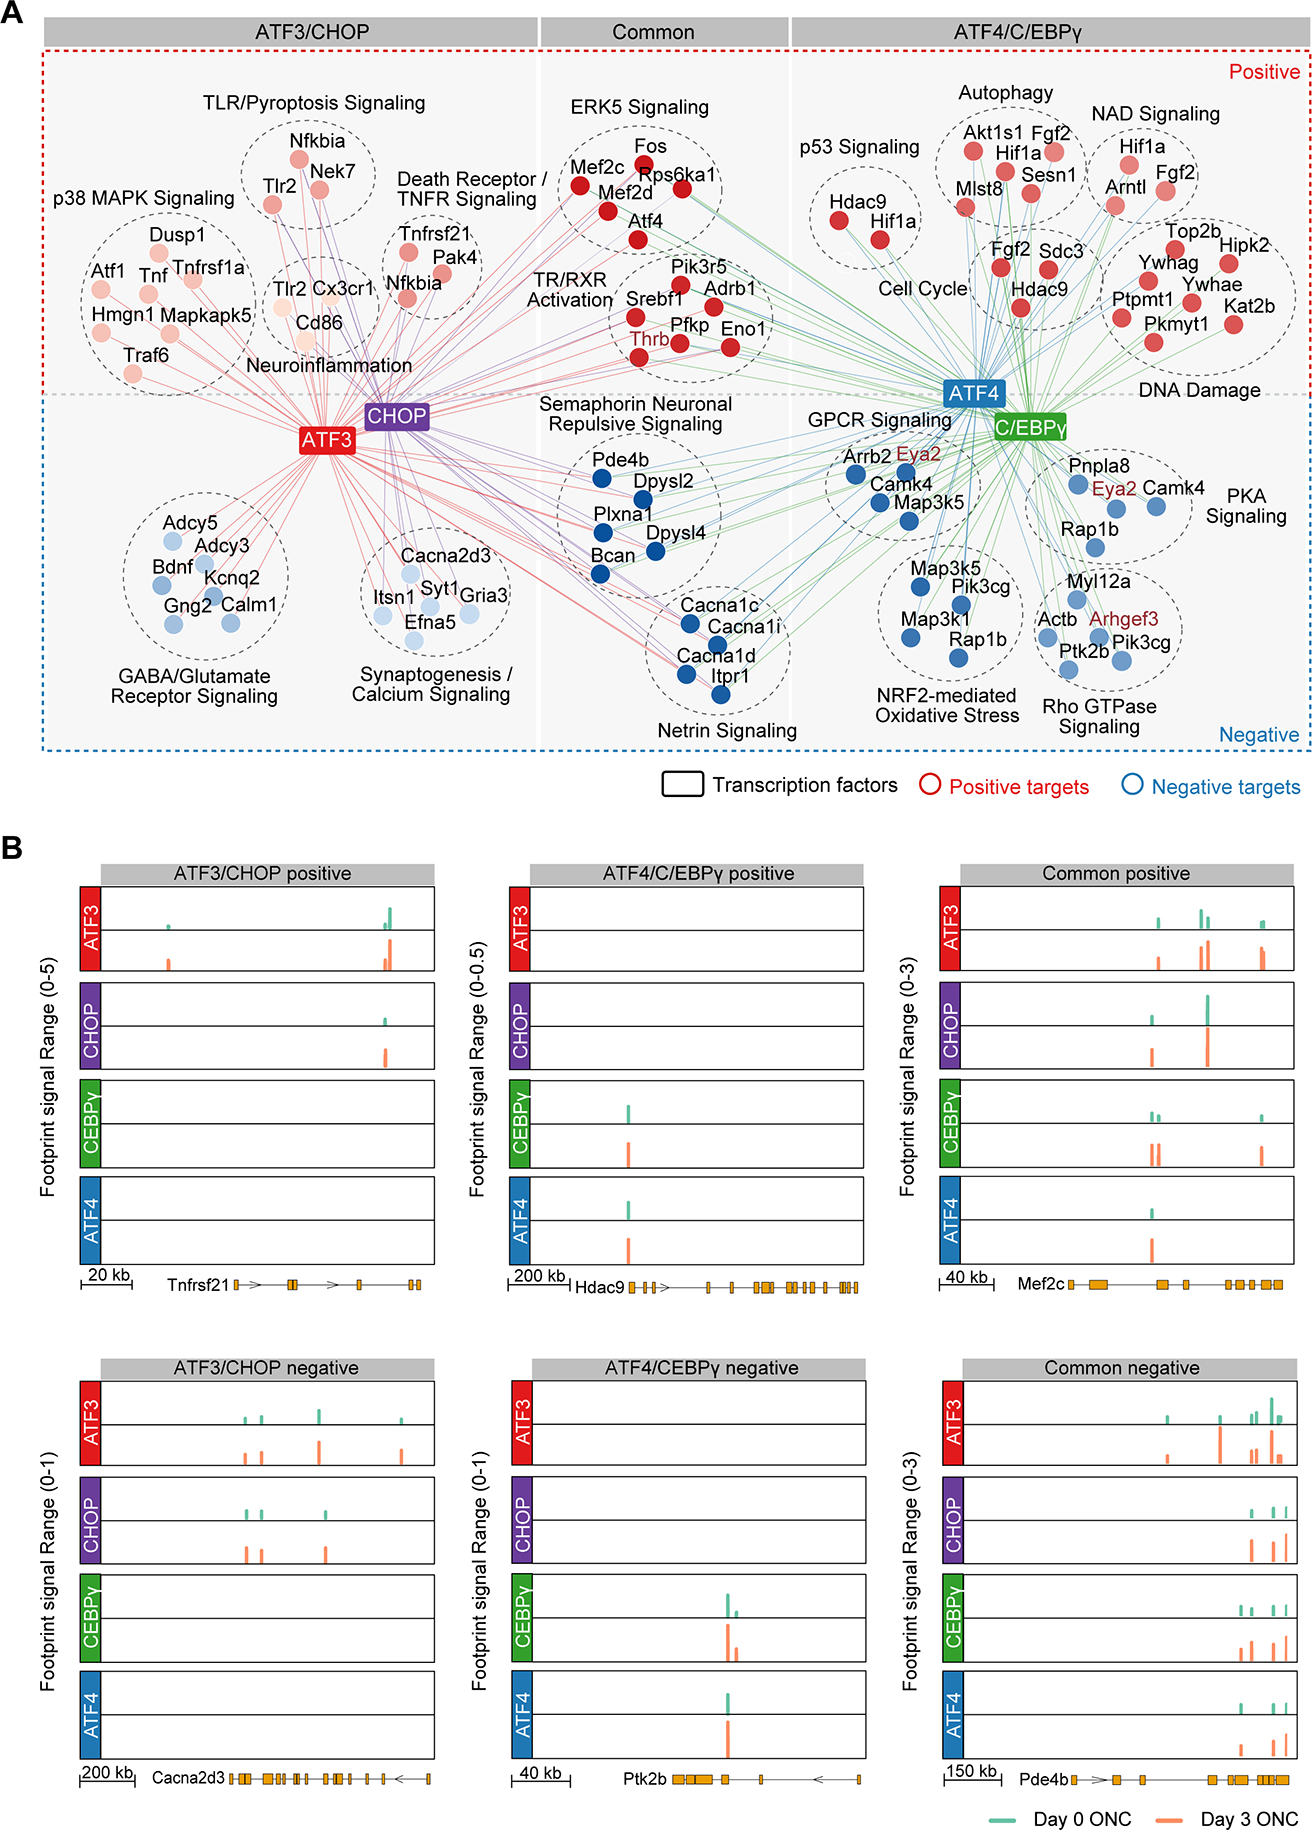
Figure 5. Two distinct transcriptional programs regulated by ATF3/CHOP or C/EBPγ/ATF4 in injured RGCs.

(A) A TF network plot showing the positive or negative targets and the associated biological pathways that are uniquely controlled by ATF3 and CHOP (ATF3/CHOP), uniquely controlled by ATF4 and C/EBPγ (ATF4/C/EBPγ), or shared by both ATF3/CHOP and ATF4/C/EBPγ (common). Representative genes in each pathway were shown. Each node indicates a gene. Node colors indicate the different GO terms, and edge colors indicate TFs.
(B-C) Genome browser views of each of 4 TF’s binding sites around representative target genes. Y-axis indicates Tn5-bias corrected footprint signals of each TF from control (day 0) or optic nerve crushed (day 3) RGCs. Shown representative genes, including both positive (B) and negative (C) targets, are selected from the three groups in (A).
