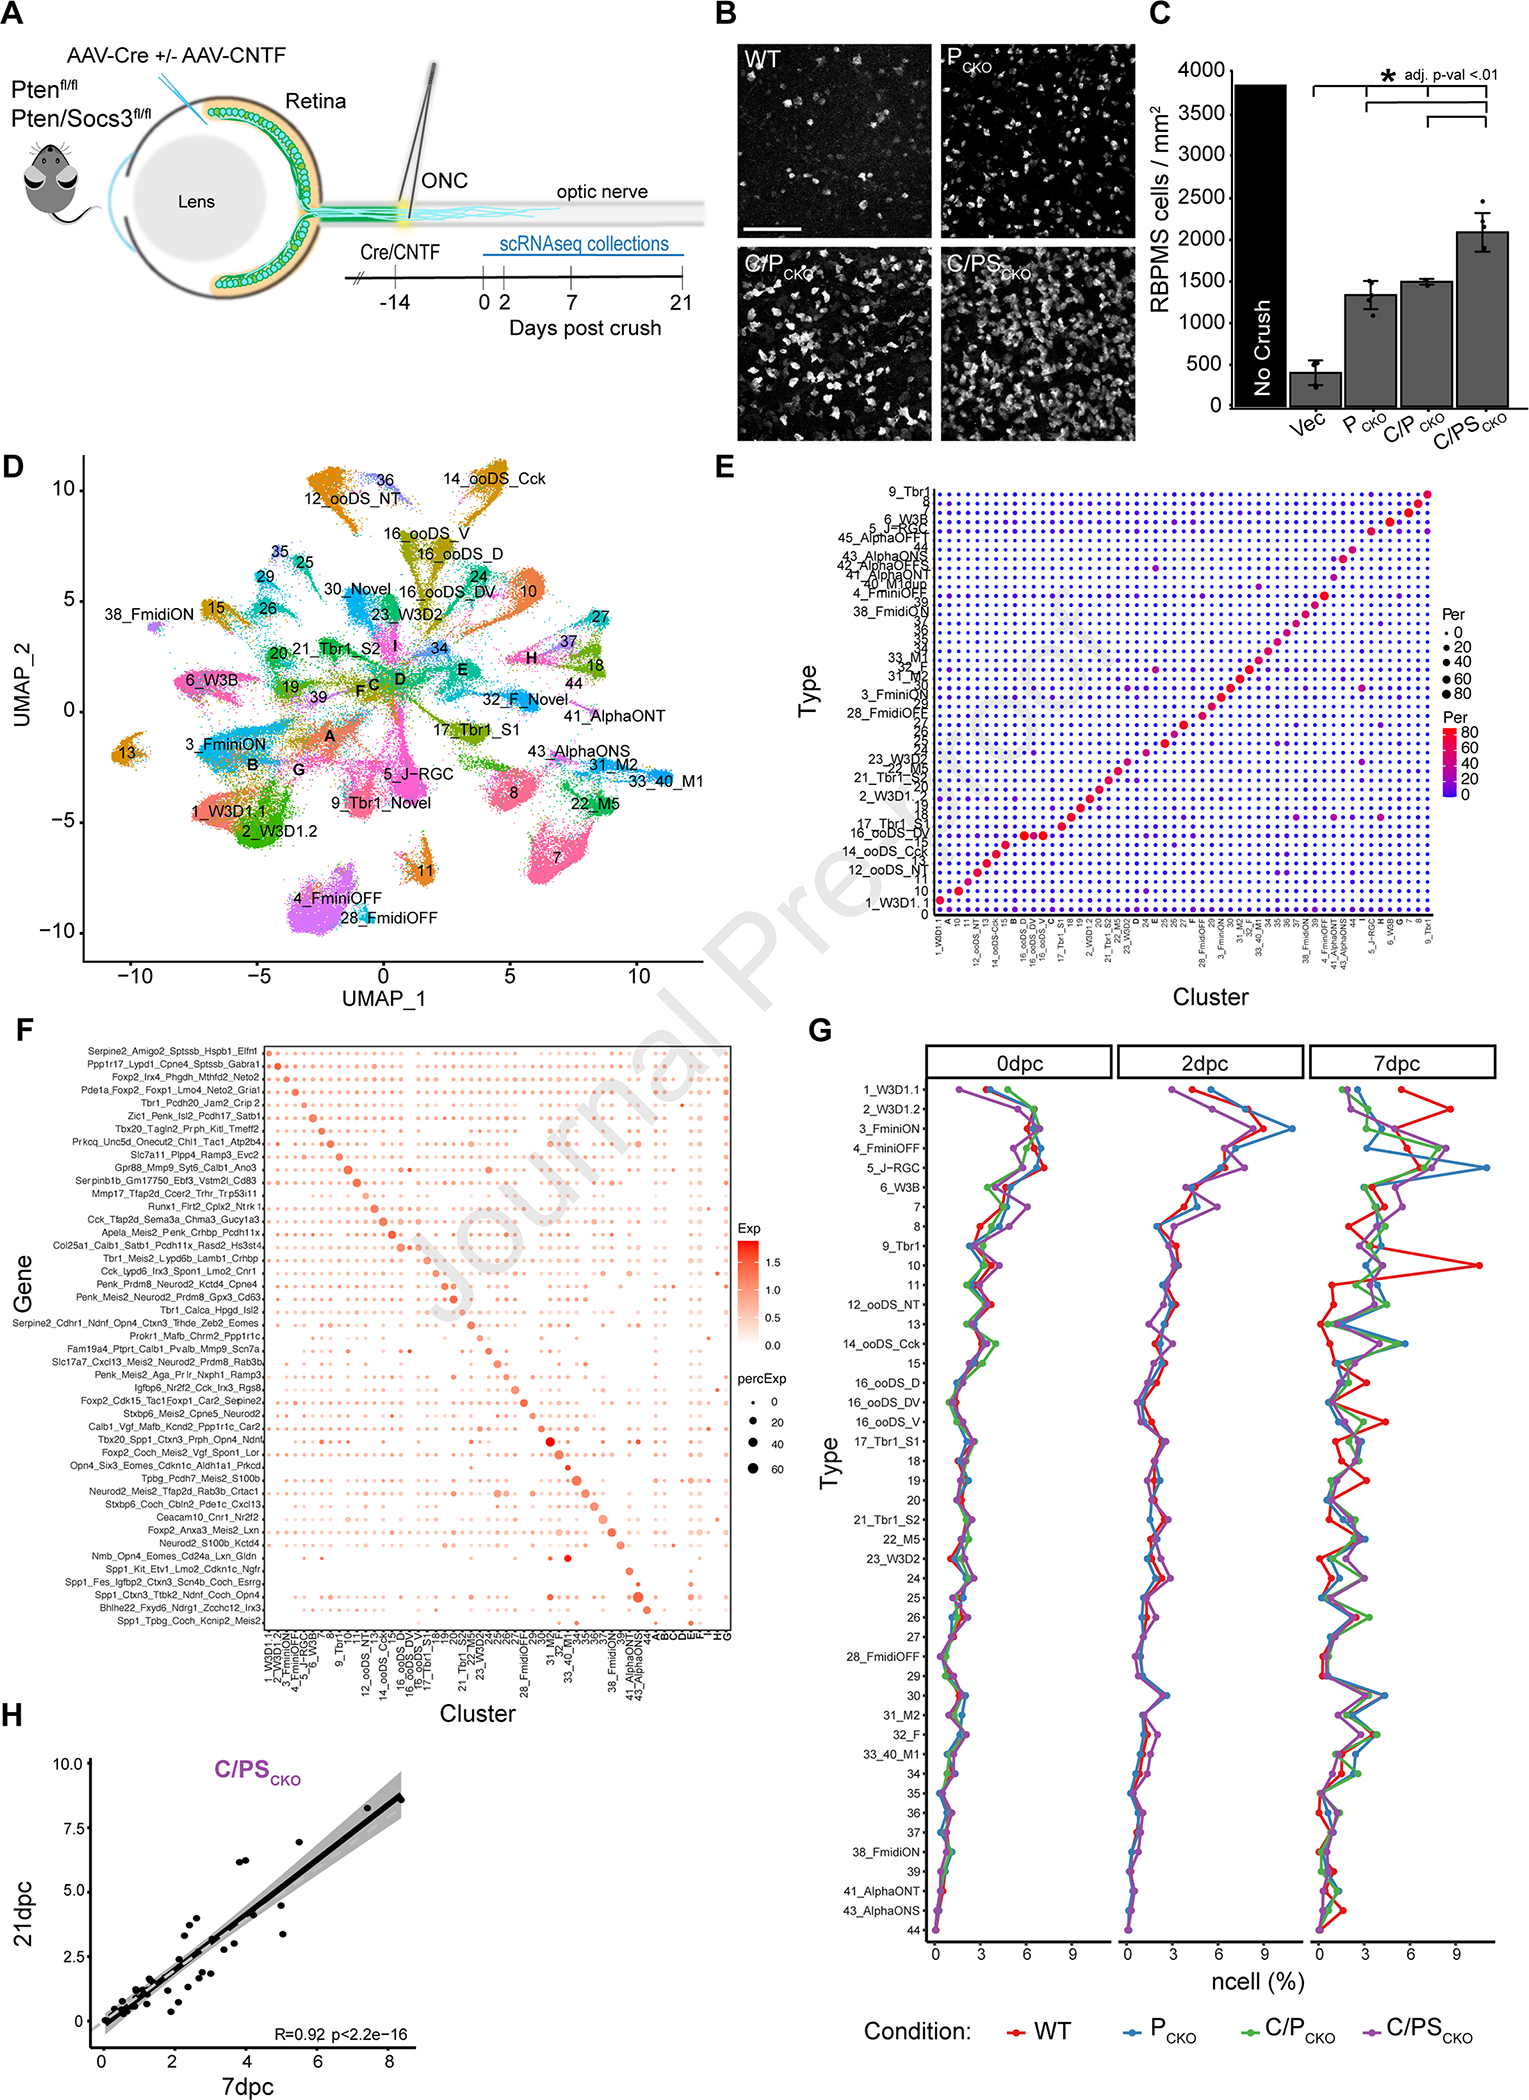
Figure 1: Interventions preserve type identity and increase survival of most RGC types after ONC.

A) AAV2-Cre was injected into the vitreous body of PTENf/f (PCKO) or Ptenf/fSocs3f/f (PSCKO) mice to delete the floxed genes 2 weeks before crushing the optic nerve (ONC). AAV2 encoding ciliary neurotrophic factor (CNTF) was co-injected as indicated (C/PCKO or C/PSCKO). RGCs were collected for scRNA-seq at indicated times thereafter.
B) Immunohistochemistry in retinal whole-mounts for the pan-RGC marker, RBPMS, shows increased survival of RGCs at 21dpc following PCKO, C/PCKO and C/PSCKO. Scale bar = 100μm
C) RGC density (RBPMS+/mm2 cells, *adjusted p-value <0.01) at 21dpc compared to uncrushed control, measured from images such as those in B.
D) scRNA-Seq data from all RGCs analyzed in this study displayed as a UMAP. Numbers indicate RGC ‘Novel ‘types as defined in the atlas presented in Tran, et al. (2019). Letters (A-G) show clusters that could not be assigned to a type.
E) Comparison of cell type mapping in the current dataset to the RGC atlas from Tran et al., (2019) shown as a confusion matrix. Dot sizes and colors represent the percentage of cells in each cluster on the x-axis that match the atlas types on the y-axis.
F) Expression of gene marker combinations from the control RGC atlas in the current dataset. Color of the dot represents the average expression of the gene marker combination, and the dot size represents the proportion of cells expressing these markers.
G) Proportion of types in WT and each intervention at 0, 2 and 7dpc.
H) Scatterplot showing correspondence (RPearson = 0.92) between frequencies of C/PSCKO RGCs of at 7 and 21dpc. Each dot shows one RGC type. The dark line shows best fit with confidence interval indicated in grey.
