
Figure 2. β2AR S-nitrosylation drives agonist-independent receptor internalization through the caveolae pathway, but not the GRK/β-arrestin2/clathrin pathway.
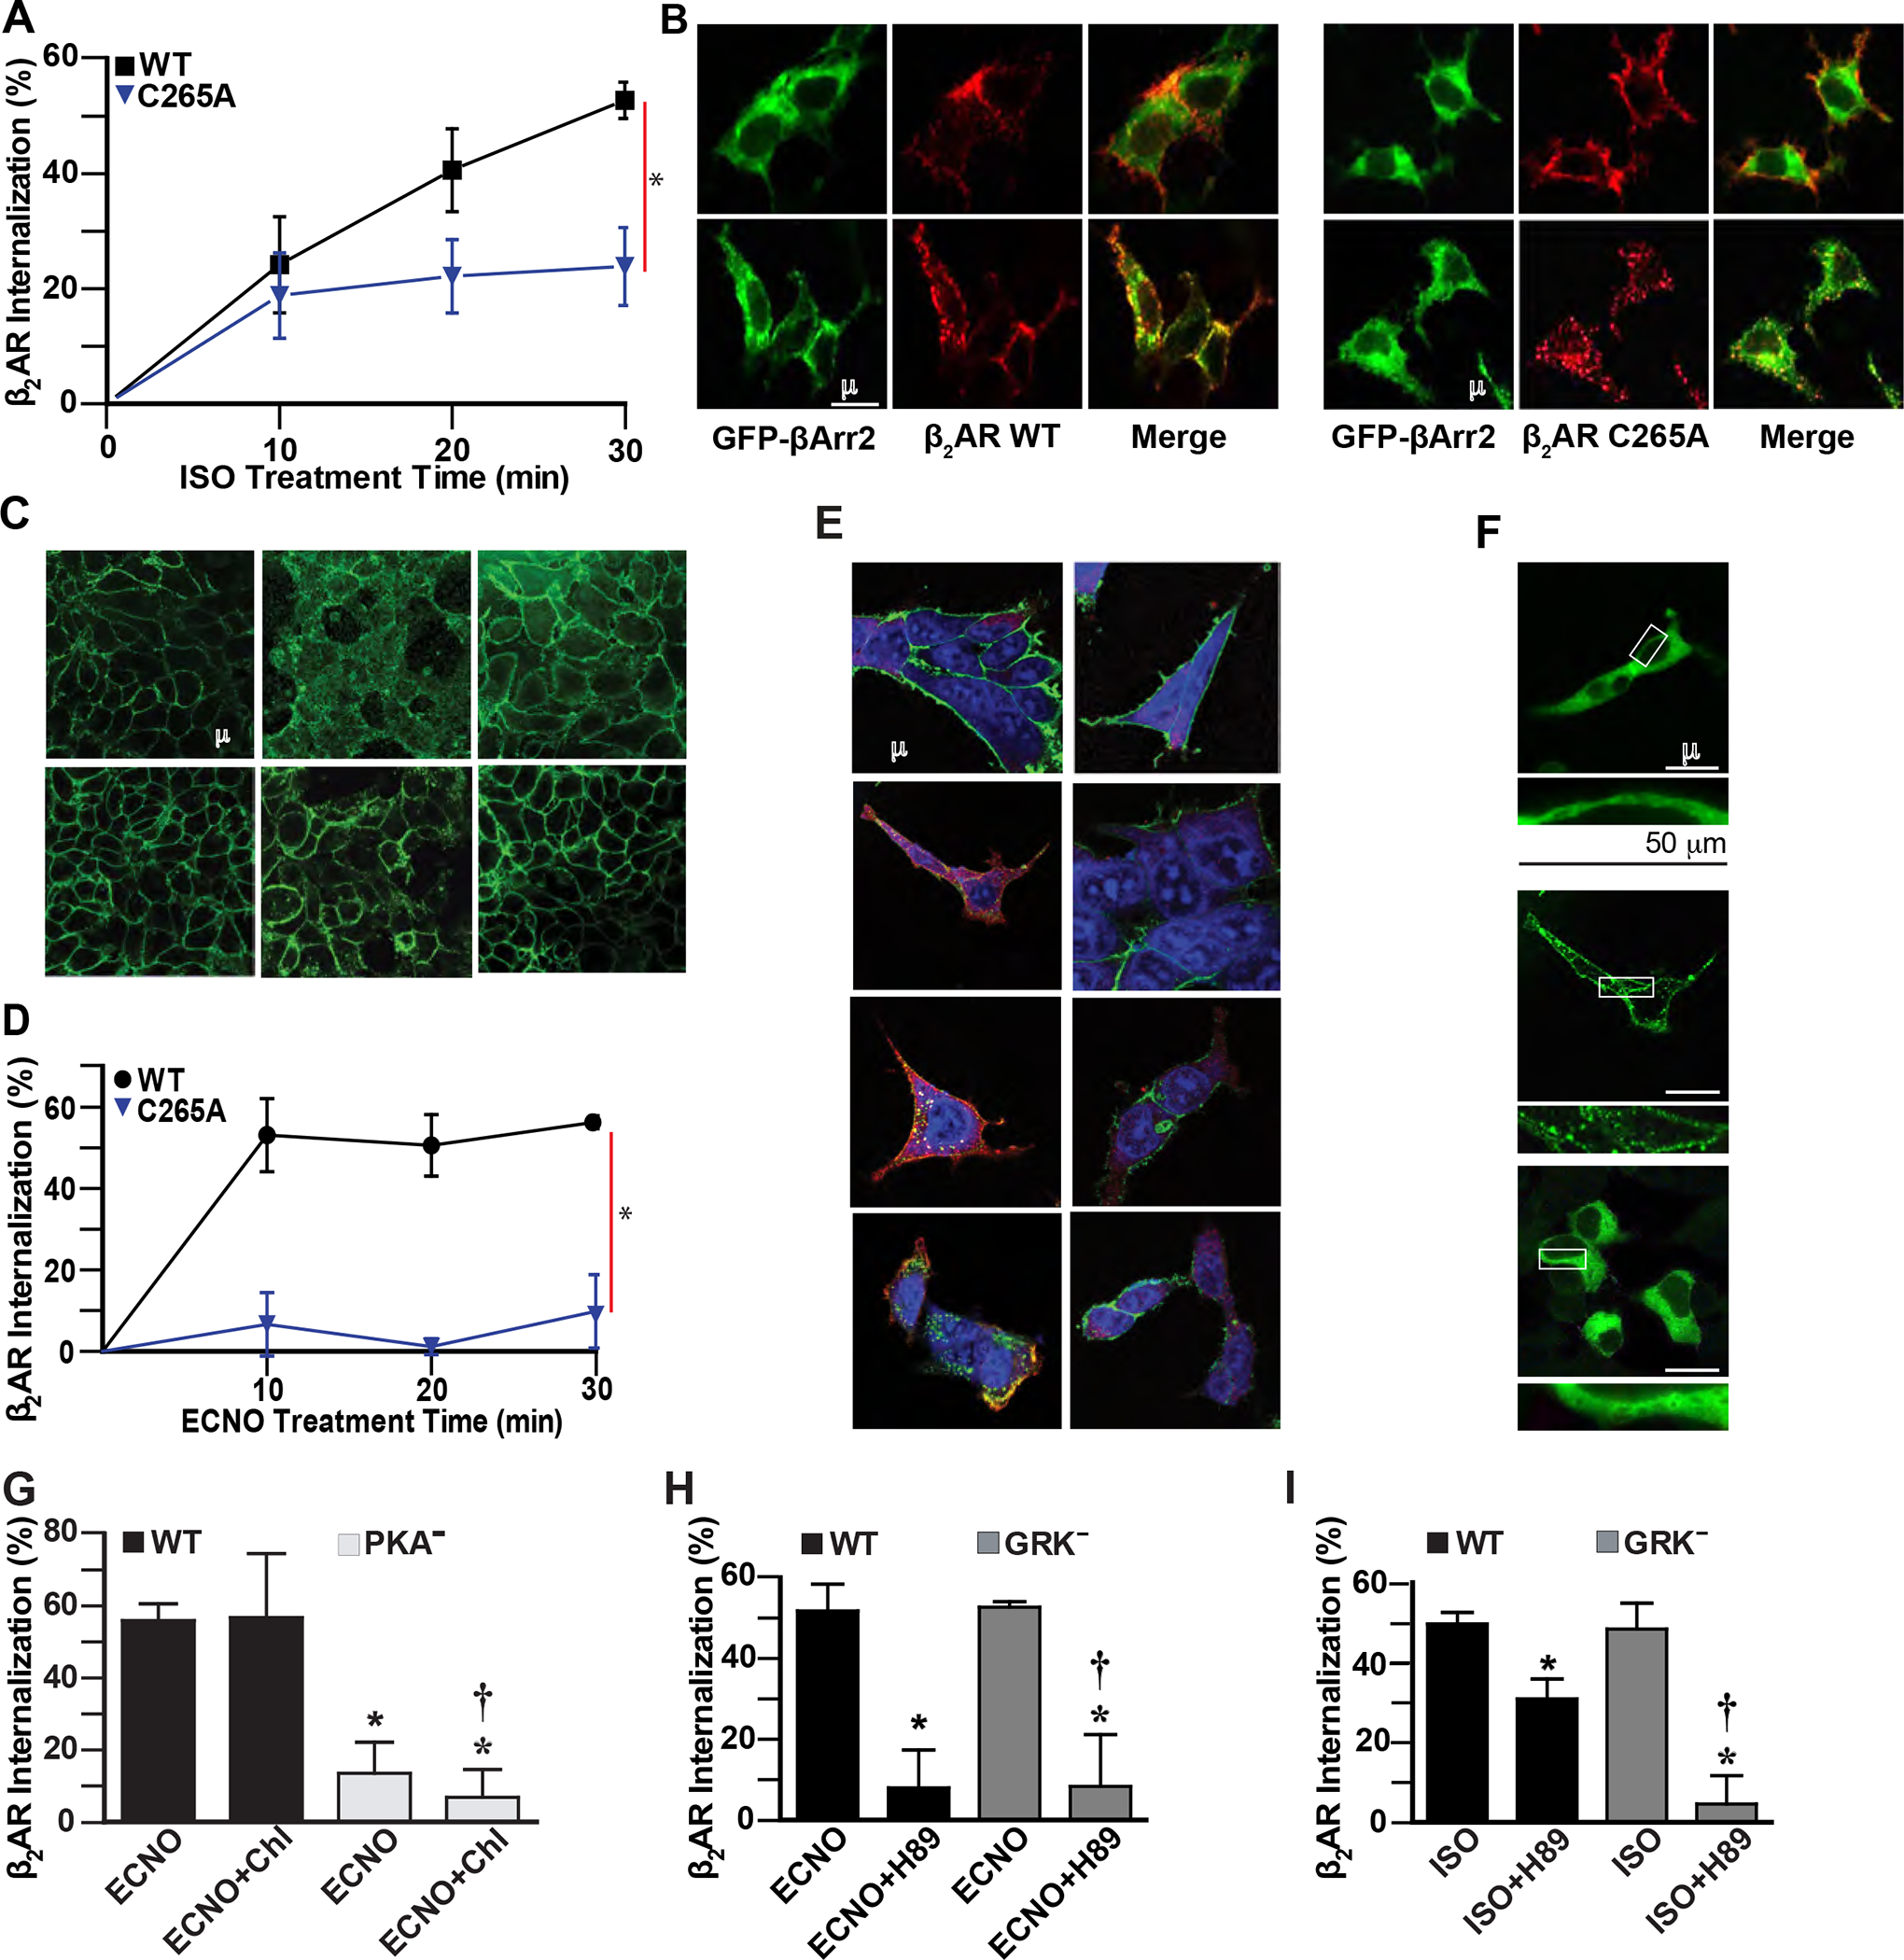
A. ISO (10 μM) induces time-dependent internalization of cell surface WT Flag-β2AR in HEK293 cells, but internalization of C265A β2AR is reduced, quantified by flow cytometry. Data are shown as mean±SD for 9 assays. * p<0.0001 for cumulative response (area under curve) for WT vs mutant using two-tail t-test test. B. ISO (10 μM, 10 min) induces colocalization of HA-β2AR or HA-β2AR C265A with β-Arrestin2-GFP (green) in HEK293 cells, detected by confocal microscopy (yellow) after labeling with anti-HA antibody/anti-rabbit AlexaFluor-568 (β2AR, red). Data are representative of 12 cells surveyed in 3 experiments. C. ECNO treatment (100 μM, 10 min) or overexpression of eNOS induces internalization of cell surface WT but not C5A mutant Flag-β2AR in HEK293 cells, detected by confocal microscopy using labeling with anti-Flag antibody and anti-mouse AlexaFluor-488. Images are representative of 5 assays. D. ECNO (100 μM) induces time-dependent internalization of cell surface WT but not C265A Flag-β2AR in HEK293 cells, quantified by flow cytometry after labeling with anti-Flag M1 and AlexaFluor-647. Data are shown as mean±SD for 3 assays. * p<0.0001 for cumulative response (area under curve) for WT vs drug-treated using two-tail t-test test. E. ISO (10 μM) treatment for the indicated times induces colocalization (yellow) of HA-β2AR and Flag-β-Arrestin2 in HEK293 cells, while ECNO (100 μM) treatment does not, detected by confocal microscopy after labeling with anti-HA antibody/anti-rabbit AlexaFluor-488 (β2AR, green), anti-Flag antibody/anti-goat AlexaFluor-568 (β-Arrestin2, red), and Draq5 (nuclei, blue). Data are representative of 15 cells surveyed in 3 experiments. F. ISO (10 μM, 10 min) induces translocation of β-Arrestin2-GFP (green) in HEK293 cells expressing WT β2AR, but treatment with ECNO (50 μM, 20 min) does not, detected by confocal microscopy. Lower panels are magnified versions of the boxed regions. Data are representative of 15 cells surveyed in 3 experiments. G. ECNO-driven (50 μM, 20 min) internalization of WT β2AR is not inhibited by the clathrin inhibitor chlorpromazine (Chl, 10 μM 1h), while the β2AR deficient in PKA phosphorylation sites (PKA−) is not internalized by ECNO, as measured by flow cytometry. Data are shown as mean±SD for 3 assays in triplicate. p<0.0001 by one-way ANOVA for treatment (F (3,32) = 75.29); * p<0.0001 vs WT ECNO and † p<0.0001 vs WT ECNO Chl by Tukey test. H. ECNO-driven (50 μM, 20 min) internalization of WT β2AR and GRK− mutant β2AR is inhibited by the PKA inhibitor H-89 (10 μM, 15 min prior to ECNO), as measured by flow cytometry. Data are shown as mean±SD for 6 assays. p<0.0001 by one-way ANOVA for treatment (F (3,20) = 84.55); * p<0.0001 vs WT ISO and † p<0.0001 vs GRK− ISO by Tukey test. I. ISO-driven (10 μM, 20 min) internalization of WT β2AR is partially inhibited by the PKA inhibitor H-89 (10 μM, 15 min prior to agonist), while internalization of GRK− mutant β2AR is completely inhibited, as measured by flow cytometry. Data are shown as mean±SD for 6 assays. p<0.0001 by one-way ANOVA for treatment (F (3,20) = 18.62); * p<0.0001 vs WT ISO and † p<0.0001 vs GRK− ISO by Tukey test.