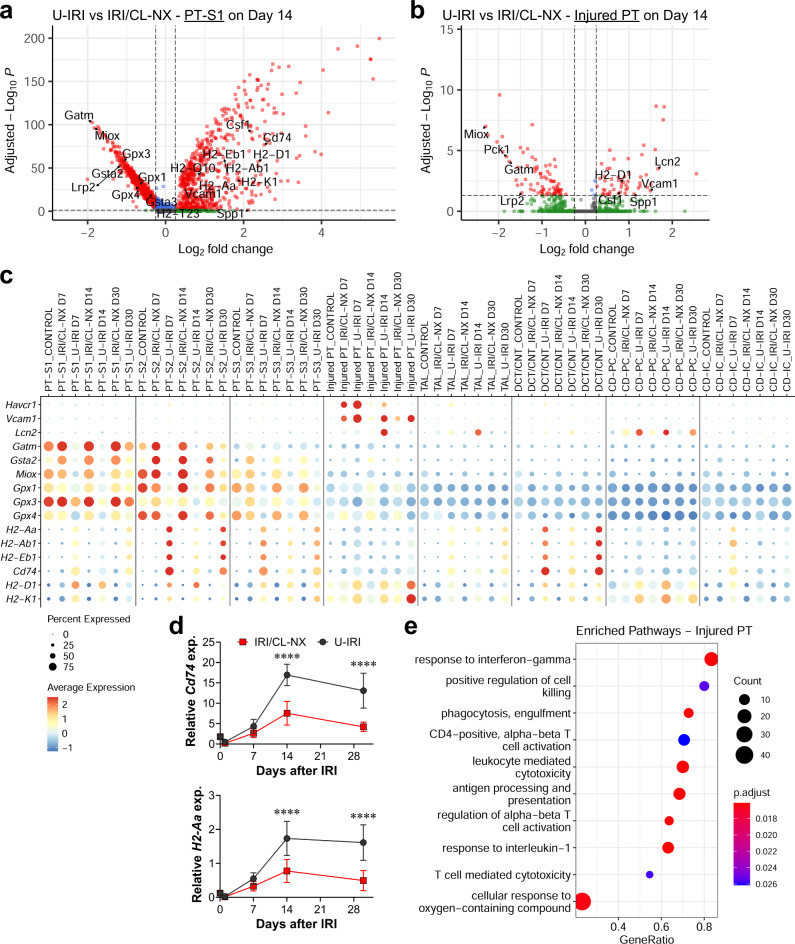
Fig. 8. Identifying the injury signature of inflammation-induced tubular stress.
Wild-type mice were subjected to 27 min of ischemia/reperfusion injury (IRI) with contralateral nephrectomy (IRI/CL-NX) or unilateral IRI (U-IRI) and sacrificed on day 7, 14, and 30 after injury. Injured kidneys and normal control kidneys were harvested for single-cell-RNA-sequencing analysis as shown in Fig. 3. a, b Volcano plots demonstrating the differential gene expression in cells from segment 1 of the proximal tubule (PT-S1, a) and injured PT (b) 14 days after U-IRI compared to IRI/CL-NX. c The distribution and relative expression of the injury markers (Havcr1, Vcam1, and Lcn2), anti-oxidative stress and detoxification genes (Gatm, Gsta2, Miox, Gpx1, Gpx3, and Gpx4), and the major histocompatibility complex class II (H2-Aa, H2-Ab1, H2-Eb1, and Cd74) and class I (H2-D1 and H2-K1) are visualized in a dot plot. d Quantitative RT-PCR analysis for indicated genes was performed on whole-kidney RNA harvested on day 0, 1, 7, 14, and 30 after injury. Data are presented as mean ± SD. n = 10 kidneys/time point/model. Two-way ANOVA is summarized in Supplementary Table 1. ****p < 0.0001 at the indicated time points (by Bonferroni multiple comparison). e Based on differentially expressed genes (DEG) between U-IRI and IRI/CL-NX kidneys on day 14 after injury, the top relevant enriched gene ontology (GO) terms for injured proximal tubule (PT) in the U-IRI kidneys are visualized in the dot plots.

