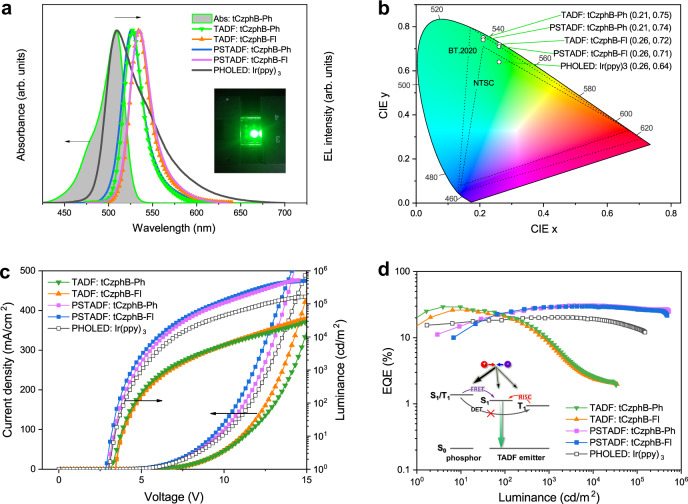
Fig. 4. OLED characteristics.
a EL spectra of the TADF OLEDs containing tCzphBs, PHOLED containing Ir(ppy)3, and the PSTADF OLEDs containing both Ir(ppy)3 and tCzphBs, to compare the absorption (Abs) spectrum of tCzphB-Ph in toluene (inset: image of the PSTADF OLED containing tCzphB-Ph). b Corresponding 1931 CIE coordinates of the device emission. c Current density-voltage-luminance characteristics of the investigated OLEDs. d EQE-luminance characteristics of the investigated OLEDs. Inset: diagram of the Förster resonance energy transfer (FRET) and reverse intersystem crossing (RISC) pathways in the PSTADF OLED. The Dexter energy transfer (DET) pathway is greatly suppressed because the low concentration of the terminal dopant prevents the approach of the excited sensitizer and the terminal dopant21.

