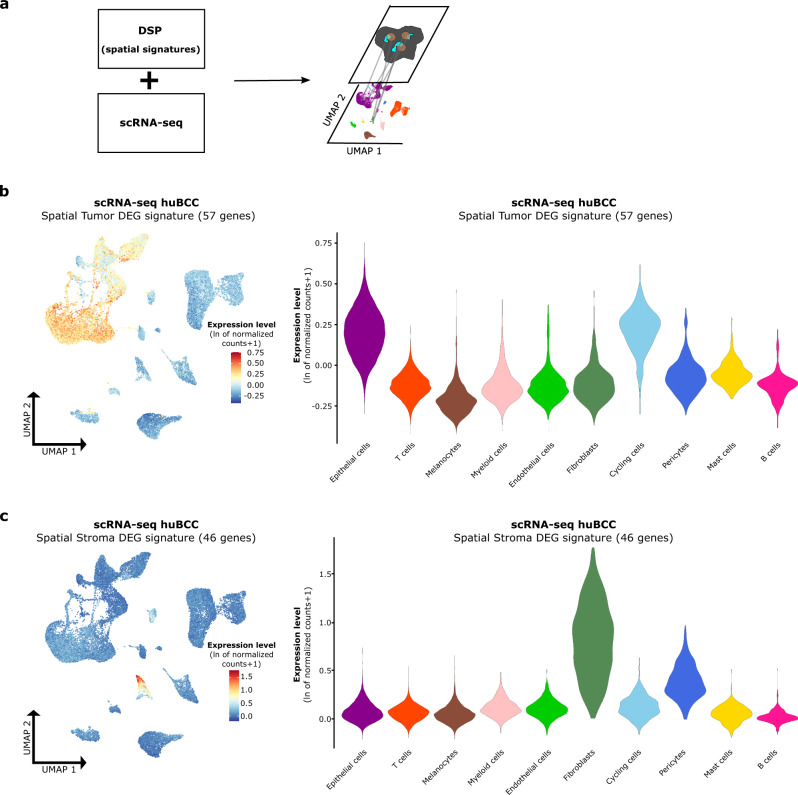
Fig. 3. Spatial signatures map cell subtypes composing the tumor–stroma interface in infiltrative BCCs.
a Overview of the analysis pipeline for the application of spatial signatures to scRNA-seq data. In brief, spatial Tumor and Stroma DEG signatures established with DSP were applied to the scRNA-seq dataset to enable the localization of cells with physical proximity on the UMAP plot. b Average expression level of the spatial Tumor DEG signature in single cells of five huBCC samples, represented as a color scale overlaid on the UMAP (left panel) and as violin plots per cell type (right panel). c Average expression level of the spatial Stroma DEG signature in single cells of five huBCC samples, represented as a color scale overlaid on the UMAP plot (left panel) and as violin plots per cell type (right panel). DSP digital spatial profiling, scRNA-seq single-cell RNA sequencing, UMAP uniform manifold approximation and projection, huBCC human basal cell carcinoma, DEG differentially expressed genes.

