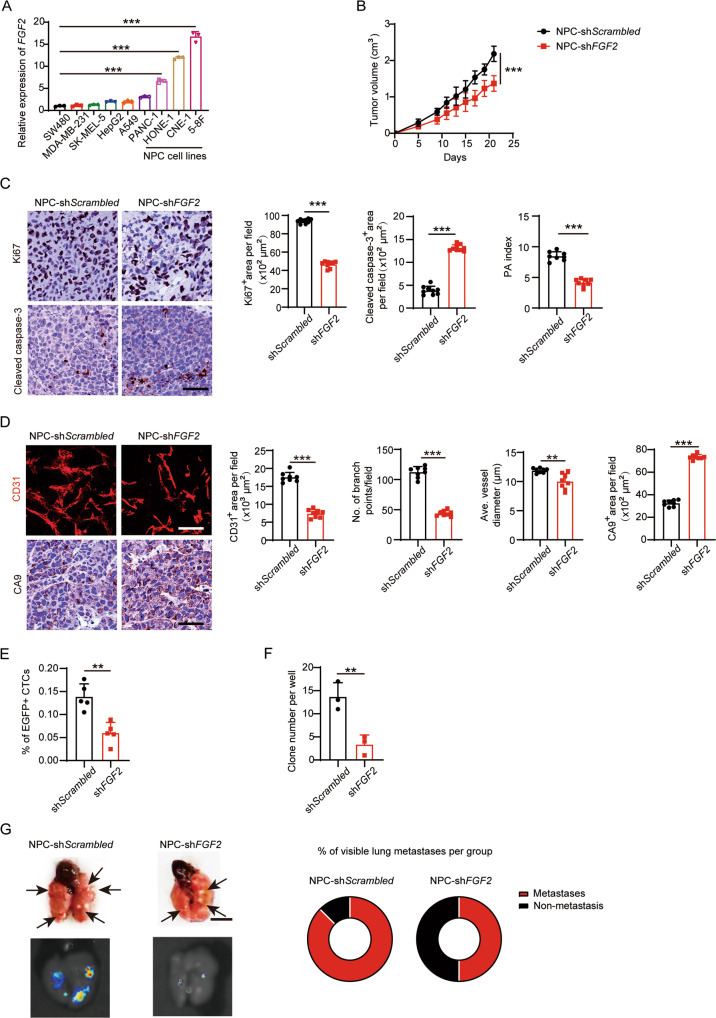
Fig. 3. Tumor cell-derived FGF-2 promotes angiogenesis and metastasis in NPC xenograft models.
A FGF2 expression levels in SW480 CRC, MDA-MB-231 breast cancer, SK-MEL-5 melanoma, HepG2 hepatocellular carcinoma, A549 lung cancer, PANC-1 pancreatic ductal adenocarcinoma, HONE-1 NPC, CNE-1 NPC, and 5–8F NPC cell lines (n = 3 samples per group). B Tumor growth of scrambled or FGF2 shRNA-transfected NPC tumor (n = 8 in NPC-shScrambled group and 6 in NPC-FGF2 group). C Representative micrographs of Ki67+ proliferative cells and cleaved caspase-3+ apoptotic cells in NPC. Scale bar = 50 μm. Quantification of Ki67+, cleaved caspase-3+ signals, and PA index in NPC (n = 8 or 9 random fields per group). D Representative micrographs of CD31+ microvessels and CA9+ hypoxic areas in NPC. Scale bar in upper panel = 100 μm, scale bar in lower panel = 50 μm. Quantification of CD31+ tumor vessel parameters and CA9+ signals in NPC (n = 8 random fields per group). E Blood samples from tumor-bearing mice were FACS analyzed for EGFP+ signals. Quantification of EGFP+ circulating tumor cells (n = 5 samples per group). F Quantification of clones after culturing NPC-bearing mice blood samples for two weeks (n = 3 samples per group). G Representative graphs of lungs from NPC-bearing mice. Arrows indicate visible metastatic nodules. Scale bar = 0.5 cm. EGFP+ metastatic signals in the lung. Quantification of pulmonary metastasis proportion (n = 6 mice per group). **P < 0.01; ***P < 0.001. NS not significant. Data presented as mean ± SD.

