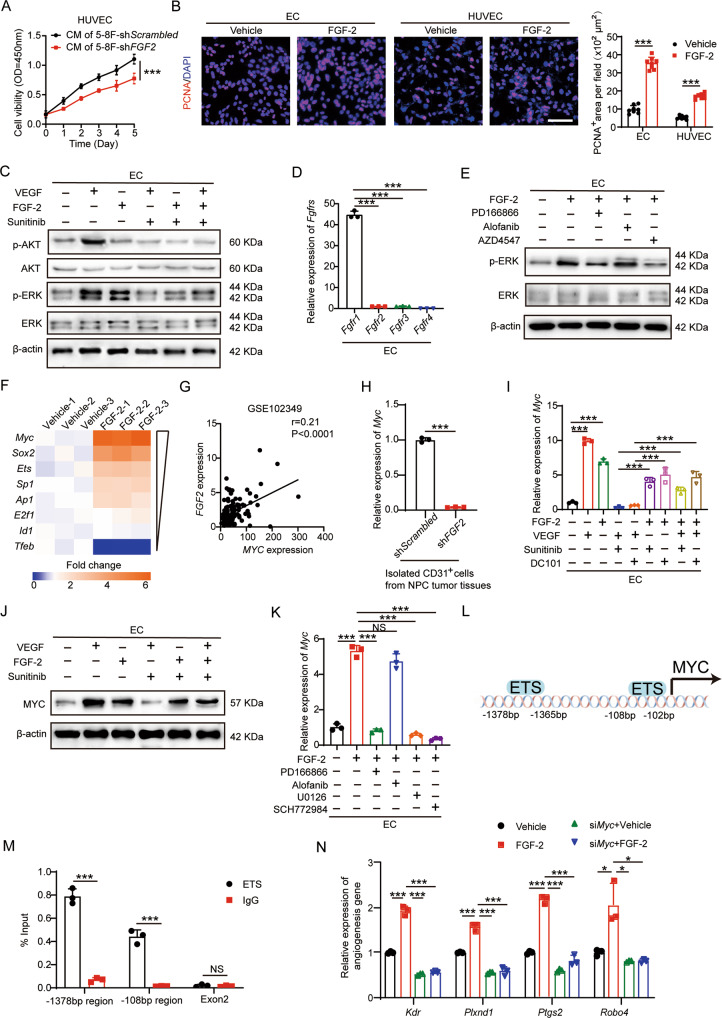
Fig. 4. FGF-2 impedes the AAD-induced anti-EC effect via FGFR1-ERK-MYC signaling.
A Cell growth of human ECs receiving the conditioned medium of scrambled- or FGF2 shRNA-transfected NPC tumor cells (n = 5 samples per group). B Representative micrographs of PCNA+ proliferative cells and DAPI signals in ECs treated with vehicle or recombinant human FGF-2. Scale bar = 50 μm. Quantification of PCNA+ signals in mouse and human ECs (n = 8 random fields per group). C Vehicle- or VEGF-treated ECs were challenged with or without sunitinib or FGF-2. Phosphorylation of AKT and ERK in ECs was detected. β-actin marks the loading level in each lane (n = 3 samples per group). D QPCR quantification of Fgfr1, Fgfr2, Fgfr3, and Fgfr4 mRNA levels in ECs (n = 3 samples per group). E Vehicle- or FGF-2-treated ECs were challenged with or without various FGFR inhibitors. Phosphorylation of ERK in ECs was detected. β-actin marks the loading level in each lane (n = 3 samples per group). F Downstream of VEGF signaling transcription factors were selected and detected in vehicle- or FGF-2-treated ECs. Heatmap of qPCR array screened out Myc as the highest upregulated transcription factor. G Correlation of FGF2 and MYC transcriptomic expression levels of human NPCs (NPC, n = 113 samples). Data was extracted from dataset GSE102349. H QPCR quantification of Myc mRNA levels in isolated mouse CD31+ ECs from scrambled- or FGF2 shRNA-transfected NPC tumor tissues (n = 3 samples per group). I QPCR quantification of Myc mRNA levels in various groups of ECs (n = 3 samples per group). J Vehicle- or VEGF-treated ECs were treated with or without AAD or FGF-2. MYC expression in ECs was detected. β-actin marks the loading level in each lane (n = 3 samples per group). K QPCR quantification of Myc mRNA levels in vehicle- or FGF-2-treated ECs, with or without various inhibitors (n = 3 samples per group). L Diagram of ETS-binding site prediction. M ChIP detection of ETS binding to the Myc gene promoter. Nonimmune IgG and Myc exon 2 regions served as controls (n = 3 samples per group). N QPCR quantification of EC proliferative marker Kdr, Plxnd1, Ptgs2, Robo4 in scrambled- or Myc siRNA-transfected ECs administrated with vehicle or FGF-2 (n = 3 samples per group). *P < 0.05; **P < 0.01; ***P < 0.001. NS not significant. Data presented as mean ± SD.

