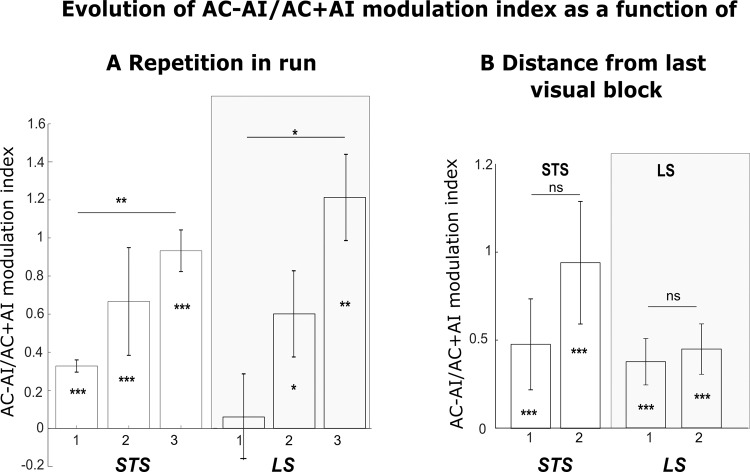
Fig. 5. Distribution of AC-AI/AC+AI modulation index as a function of repetition in run and distance from last visual block.
Distribution of modulation index of percentage signal change (%SC) for the AC condition relative to fixation baseline compared to the AI condition relative to fixation baseline (AC − AI/AC + AI), as a function of repetition order in the run (A) or as a function of the distance from the last visual block (B), for each of the STS and LS, and each of the face and social runs, computed on individual ROIs across all runs. In (A), 1: first occurrence of AC or AI, 2: second occurrence, 3: third occurrence. In (B), 1: AC or AI just following a block with visual stimuli presentations, 2: AC or AI presented two blocks away from a block with visual stimuli presentations. Statistical differences relative to baseline or across conditions are indicated as follows: ***, p < 0.001; **, p < 0.01; *, p < 0.05; n.s., p > 0.05 (Wilcoxon two-sided non-parametric test: (A) STS 1: n = 14, Z = 3.21, p = 1.6e-06; 2: n = 14, Z = 3.41, p = 6.4e-04; 3: n = 14, Z = 4.78, p = 1.7e-06; 1–2: Z = 1.58, p = 0.11; 1–3: Z = 4.16, p = 0.003; 2–3: Z = 1.81, p = 0.06. LS: 1: n = 10, Z = 1.57, p = 0.11; 2: n = 10, Z = 2.38, p = 0.02; 3: n = 10, Z = 4.38, p = 0.01; 1–2: Z = 1.77, p = 0.07; 1–3: Z = 2.3, p = 0.02; 2–3: Z = 0.86, p = 0.38. B STS: 1: n = 196, Z = 3.26, p = 6.7e-12; 2: n = 196, Z = 3.62, p = 6.9e-12; 1–2: Z = 1.58, p = 0.19; LS: 1: Z = 3.18, p = 5.1e-12; 2: Z = 3.28, p = 6.7e-10; 1–2: Z = 0.05, p = 0.8). Data are presented as median ± s.e.

