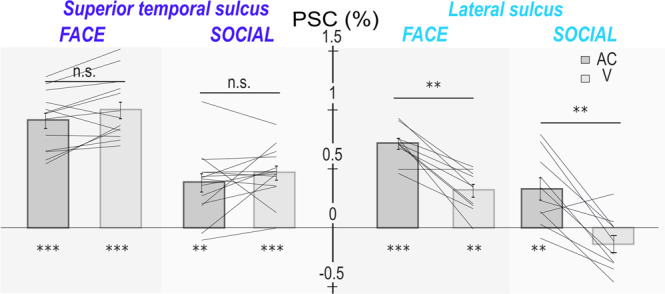
Fig. 8. Percentage of signal change (PSC) across all lateral sulcus (light blue) and superior temporal sulci (dark blue) ROIs of both hemispheres, comparing the auditory and visual contexts (median ± s.e., single lines correspond to the PSC computed over single ROIs from the group analysis; n = 14 ROIs for STS and n = 10 ROIs for LS).

Statistical differences relative to fixation are between contexts and indicated as follows: ***, p < 0.001; **, p < 0.01; n.s., p > 0.05 (Wilcoxon two-sided non-parametric test). STS: FACE: AC: n = 560, Z = 16.14, p = 4.1e-57; V: n = 560, Z = 19.35, p = 1.8e-68; AC vs V: Z = 1.68, p = 0.09. SOCIAL: AC: n = 1106, Z = 11.49, p = 0.0011; V: n = 1106, Z = 14.87, p = 1.5e-49; AC vs V: Z = 2.4, p = 0.051. LS: FACE: AC: n = 400, Z = 11.65, p = 2.4e-31; V: n = 400, Z = 4.84, p = 0.002; AC vs V: Z = 3.97, p = 0.01. SOCIAL: AC: n = 790, Z = 5.86, p = 0.002; V: n = 790, Z = −0.7, p = 0.45; AC vs V: Z = 4.7, p = 0.0013.
