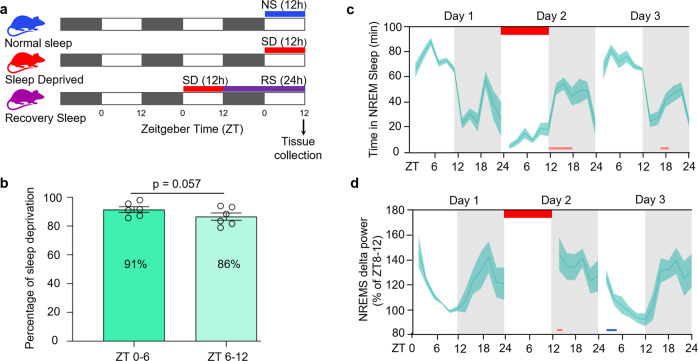
Fig. 1. Study design and EEG validation of sleep phenotype during sleep deprivation experiment.
a Experimental timeline and tissue collection schedule (black bars represent darkness, white bars indicate periods of light). b Percentage of wakefulness during the first half (ZT0-6) and the second half (ZT6-12) of sleep deprivation. c, d Ribbon plots showing the time course of 2 hourly binned values of (c) NREM state and (d) NREM delta (δ)-power percentage of ZT8-12 from Day 1. Horizontal red bar represents the timeline of sleep deprivation (Day 2, ZT 0-12; 12 h duration). Pink and blue bars under the plots denote significant increase and decrease, respectively, compared to Day 1 (P < 0.05). Data are mean ± s.e.m. n = 6 biological replicates. Paired t-test, two-tailed (b). Repeated-measures two-way ANOVA followed by post-hoc Fisher’s Least Significant Difference (LSD) test (c and d). For sample sizes and statistics, see Supplementary Data 1.

