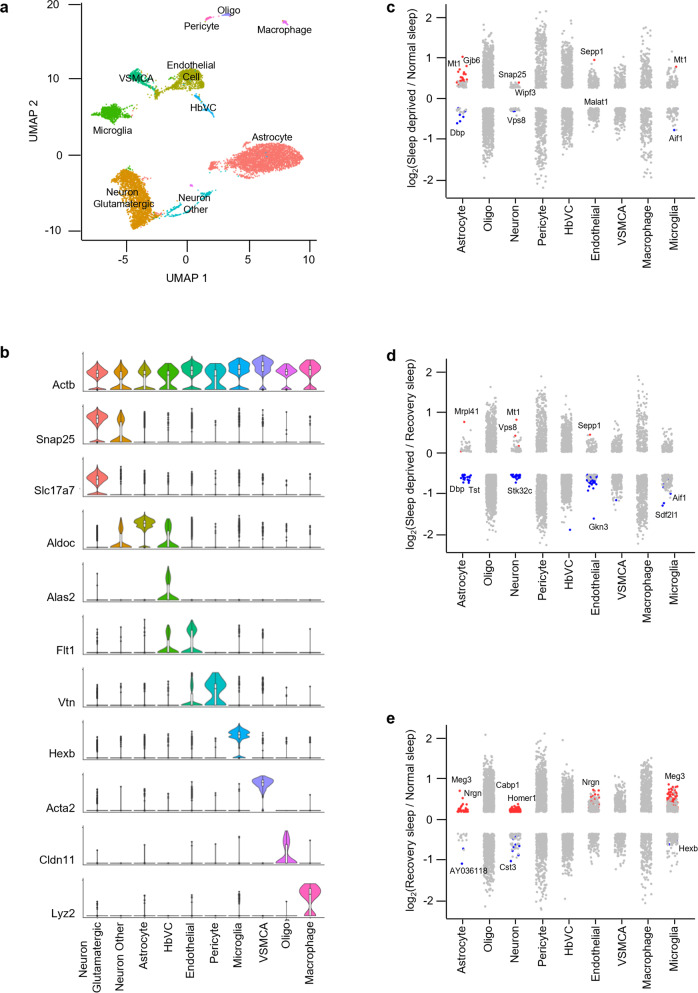
Fig. 4. Sleep treatments alter the expression profile of cells in the cortex.
a UMAP visualization of cortex cells clustered. Cell clusters were colour coded and annotated based on their transcriptional profiles (See details in Methods). b Violin plots for each cluster show the expression level of selected known cell-type enriched markers. Actb (beta-actin) is shown as a positive control in all cell types (see Supplementary Table 1). c–e Strip chart showing changes in gene expression of Sleep Deprived (SD)/Normal Sleep (NS) (c), Sleep Deprived (SD)/Recovery Sleep (RS) (d), and (e) Recovery Sleep (RS)/Normal Sleep (NS) comparisons. Wilcoxon rank-sum tests followed by false discovery rate (FDR) analysis were used to compare the groups. Significantly upregulated and downregulated genes are colour coded with red and blue, respectively (Bonferroni adjusted P value < 0.1). Genes in grey are not significantly changed after sleep deprivation (see Supplementary Table 2). HbVC hemoglobin-expressing vascular cells, Oligo oligodendrocytes, VSMCA Vascular smooth muscle cells, arterial.

