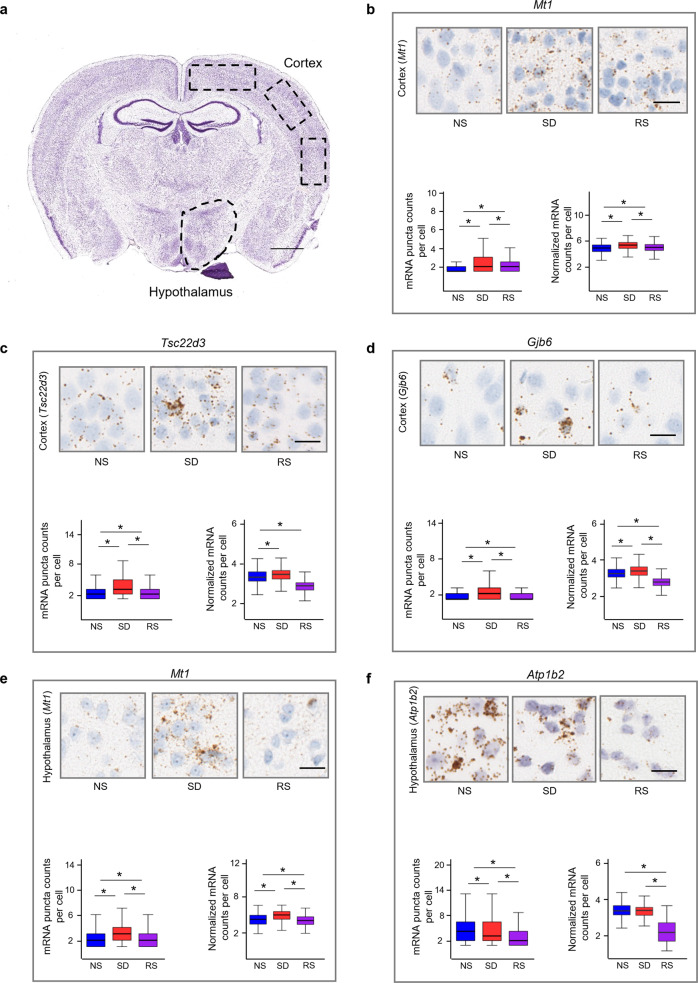
Fig. 6. In situ hybridisation validation of transcriptional changes following sleep treatments.
a Regions of interests (ROIs) for RNAscope analysis are shown on the coronal micrograph, scale bar, 1 mm (from Allen Brain Atlas). b–f Comparison of RNAscope single cell in situ hybridization and sequencing of (b) Mt1, (c) Tsc22d3, (d) Gjb6 expression in cortex, and (e) Mt1, (f) Atp1b2 expression in hypothalamus across sleep treatment groups. Micrographs of mouse cortices and hypothalamic shown. mRNA molecules are brown dots as revealed by Diaminobenzidine (DAB), and nuclei are counterstained blue (with haematoxylin). Scale bar, 20 µm. mRNA were counted from cells of n = 3 biological replicate brains per group. Kruskal–Wallis test followed by post-hoc Dunn test. Boxplots represent lower bases as minimum, upper top as maximum, and dark horizontal lines within boxes as median. *P < 0.01. NS normal sleep, SD sleep deprived, RS recovery sleep. For sample sizes and statistics, see Supplementary Data 1.

