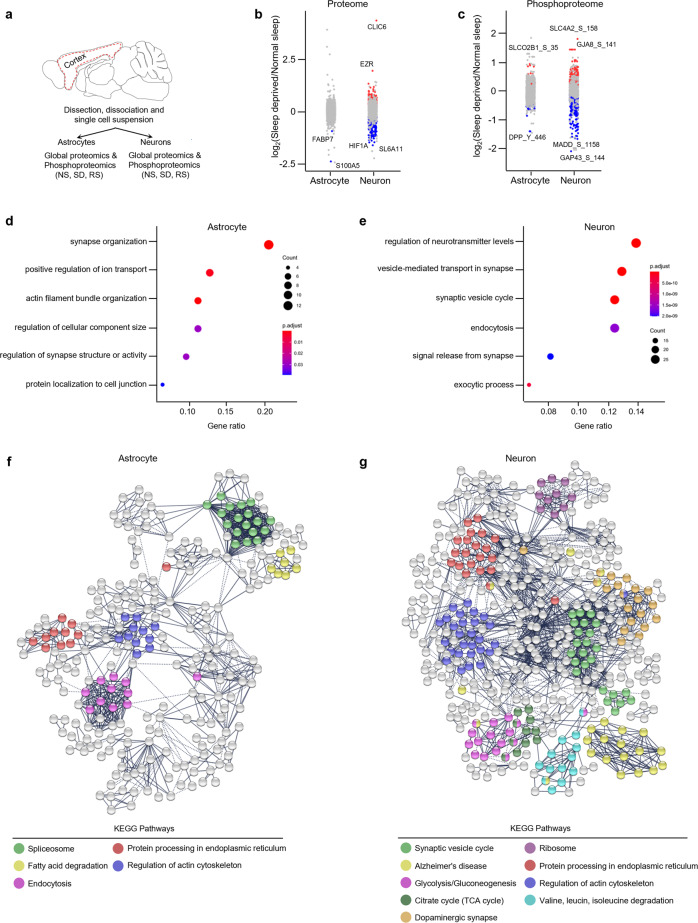
Fig. 8. Sleep deprivation regulates the global and phosphoproteome of astrocytes and neurons in the cerebral cortex.
a Schematic of proteomics workflow. Dotted red line indicates the area of the cortex dissected for magnetic cell separation (see Methods). b, c Strip charts showing changes in (b) global and (c) phosphoproteome for Sleep Deprived (SD)/Normal Sleep (NS) comparisons in astrocytes and neurons. Unpaired t-tests followed by false discovery rate (FDR) analysis were used to compare groups. Significantly upregulated and downregulated protein expression is colour coded with red and blue, respectively (Benjamini-Hochberg adjusted P value < 0.1). Proteins in grey are not significantly changed after sleep deprivation. d, e Dot plots showing significantly enriched top functional annotations from global proteomes of (d) astrocytes and (e) neurons. Circle size is proportional to protein count and level of significance (Benjamini-Hochberg adjusted P value < 0.05) is colour coded (see Supplementary Tables 6 and 7). f, g Interaction networks of significantly altered (FDR < 0.1) global proteins in (f) astrocytes and (g) neurons across sleep treatments. Functional enrichment of proteins (KEGG pathways) in the network is colour coded. The networks were generated using STRING Version 11.0 database (PPI enrichment P value < 0.001).

