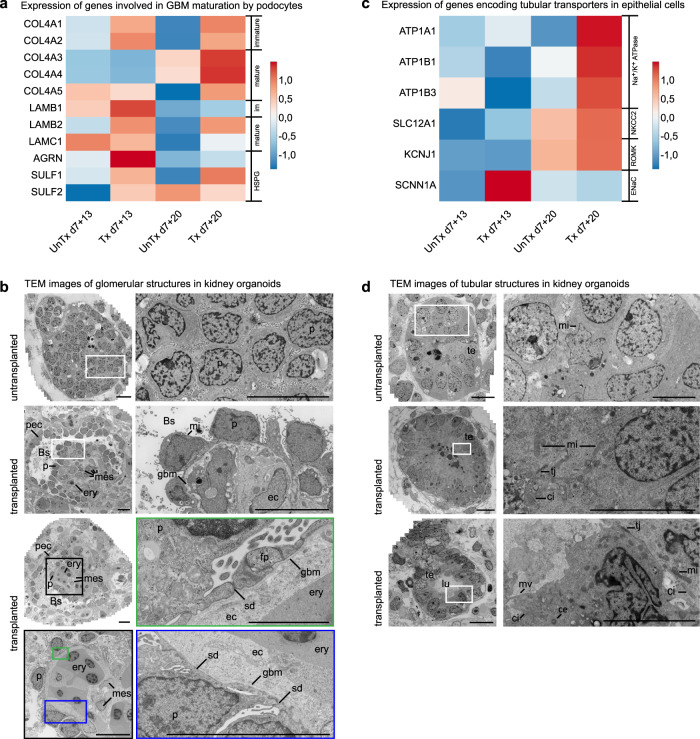
Fig. 4. hiPSC-derived kidney organoids mature upon transplantation.
a Expression-level scaled heatmap of genes involved in GBM development in podocytes in untransplanted versus transplanted kidney organoids at different timepoints. COL4A3-5 and LAMB2 are upregulated in d7+20 transplanted podocytes compared to all other conditions, fitting with the switch from collagen IV α1α2α1 to collagen IV α3α4α5 and from laminin β1 to laminin β2 during GBM maturation. LAMC1 and AGRN, encoding laminin γ1 and agrin (a heparan sulfate proteoglycan HSPG) in the mature GBM are not upregulated in d7+20 transplanted podocytes, implying the GBM in the organoids is not fully matured. Scale: z-score of the gene expression level. b Transmission Electron Microscopy (TEM) imaging displays maturation of glomerular structures upon transplantation for 8 days. Podocyte clusters are invaded with capillaries containing erythrocytes and supported by mesangial cells. Parietal epithelial cells form a Bowman’s capsule, a glomerular basement membrane is deposited between the podocytes and endothelial cells, and rudimentary slit diaphragms are formed between primitive foot processes. Magnifications of the boxed areas are displayed, Bs Bowman’s space, ec endothelial cell, ery erythrocyte, fp foot process, gbm glomerular basement membrane, leu leukocyte, mes mesangial cell, mi mitochondrion, p podocyte, pec parietal epithelial cell, sd slit diaphragm. Scale bars 10 µm. Scale bar magnification marked in green 2 µm. c Expression-level scaled heatmap of genes encoding tubular transporters in untransplanted versus transplanted kidney organoids at different timepoints. Expression of genes encoding the transporters Na+/K+ ATPase, NKCC2 and ROMK are upregulated in transplanted organoids at d7+20. SCNN1A, which encodes the α-subunit of the ENaC channel, is not upregulated. Scale: z-score of the gene expression level. d Upon transplantation for 8 days, tubular structures also show signs of maturation. Tubular epithelial cells have formed a monolayer and their nuclei have moved toward the basolateral side of the cell. Tight junctions, cilia, a centriole, microvilli and abundant mitochondria are visible. ce centriole, ci cilium, lu lumen, mi mitochondrion, mv microvilli, te tubular epithelium, tj tight junction. Scale bars images left row 10 µm, scale bars magnifications right row 5 µm. TEM Images based on 5 transplanted organoids from 2 experiments using 2 cell lines (MAFB (here)) and LUMC0072 (Supplementary Fig. 1C, D).

