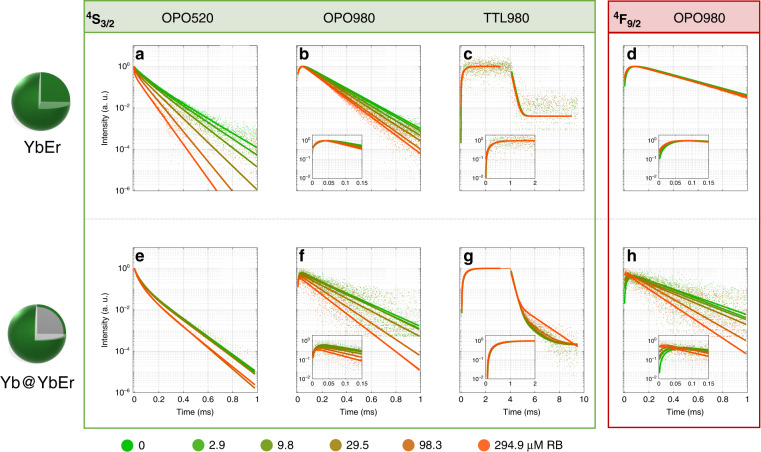
Fig. 3. Qualitative comparison of luminescence kinetics of YbEr and Yb@YbEr samples undergoing in UC-LRET.
Luminescencekinetics for emission of energy levels. 4S3/2 (525–550 nm) and 4F9/2 (650 nm) emission from (a–d) YbEr core only and (e–h) Yb@YbEr core-shell UCNPs, respectively, at a rising concentration (0, 2.9, 9.8, 29.5, 98.3, and 294.8 µM) of Rose Bengal attached on their surface. Various excitation modes were compared: a, e 520 nm 10 ns pulse from OPO laser; b, d, f, h 980 nm 10 ns pulse from OPO laser; c, g 980 nm 4 ms pulse from TTL controlled 10 W CW laser diode. Additionally, luminescence decays of 4F9/2 level emission of Er3+ under 980 nm with 10 ns pulse from OPO are shown (d, h). The insets contain magnified rise time regions on the corresponding kinetic profiles. A complete set of data for green and red emissions is presented in SI

