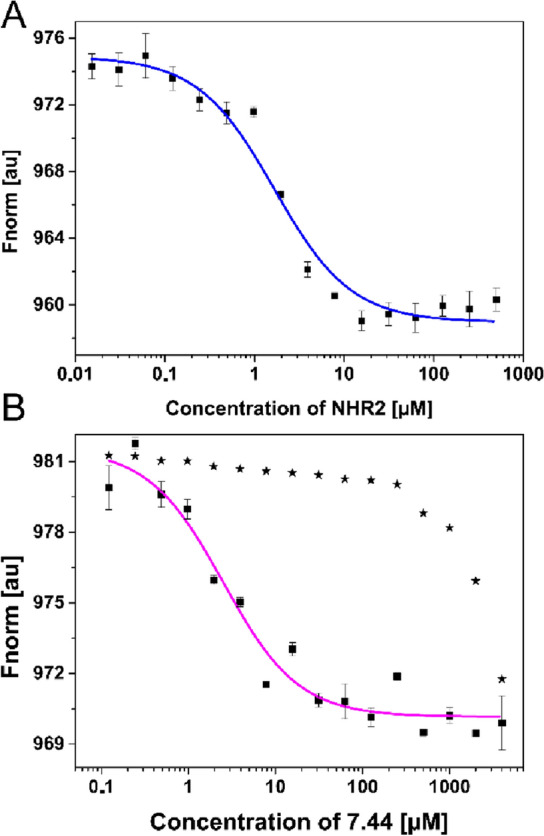
Figure 3.

7.44 binding to NHR2 detected with MST. (A) Titration of unlabeled NHR2 to a constant concentration of labeled NHR2 induces a change in thermophoresis. Ktet = 1.60 ± 0.32 µM was calculated using Eq. (2). (B) Titration of 7.44 to a constant concentration of labeled NHR2 induces a change in thermophoresis, shown in square symbols. EC50 was calculated by fitting the data points to Eq. (3). The fitted values are shown in Table 1. The range of Hill coefficients n = 1–1.5 was obtained from the fits. When titrating 7.44 to a constant concentration of labeled Histag-SUMO-M5 variant (all five hotspot residues were mutated to alanine), the magnitude of the thermophoresis appears to be the same, but the affinity is about three orders of magnitude lower (shown in star symbols). Error bars denote the standard error in the mean and were calculated from technical triplicate.
