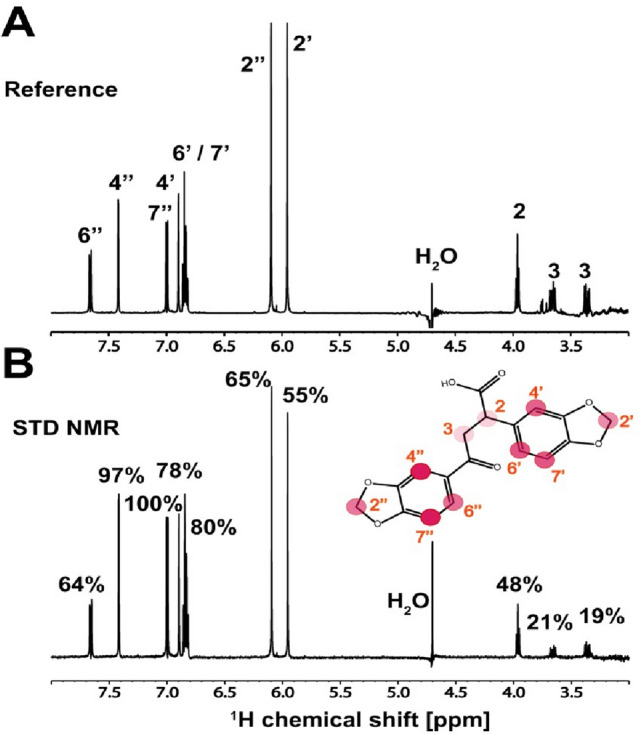
Figure 4.

1H STD-NMR experiment of 7.44 binding to NHR2. (A) Reference spectrum of 7.44. Assignment of the individual peaks is indicated (see 7.44 structure in the bottom panel). (B) 1H STD-NMR spectrum of ligand 7.44 in the presence of NHR2. Relative intensities are indicated on top of the corresponding peaks and mapped onto the structure of 7.44. The circles are colored by the relative intensity of the protons, which is correlated with the proximity to the protein: red—100% (the closest), lighter red—97% to 64%, faded red—48% to 19%. The proton numbering is indicated by the red numbers. Data was acquired at 600 MHz and 298 K, with a 100-fold molar excess of 7.44.
