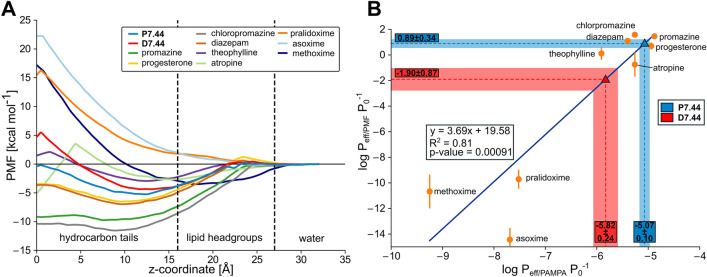
Figure 8.
(A) Potential of mean force (PMF) of permeation of 7.44 in a protonated (P7.44, blue) and deprotonated (D7.44, red) form, and nine calibration molecules. As a reaction coordinate, the distance to the center of a DOPC membrane bilayer was used, setting the profile in the water phase to zero. Molecules with a higher permeability (like progesterone or promazine) display favorable free energy in the membrane center, while those that are impermeable (like the oximes) display a high energy barrier in the membrane center. (B) Calibration curve between the calculated permeabilities obtained from MD simulations and the experimental values obtained from PAMPA experiments from58. In blue (P7.44) and red (D7.44) are the results obtained from the simulations (y-axis, 0.89 ± 0.34 and −1.90 ± 0.87 for P7.44 and D7.44, respectively), and the corresponding predictions obtained from the calibration curve (−5.07 ± 0.10 and −5.82 ± 0.24, respectively), indicating that 7.44 is highly permeable in its protonated state and low to medium permeable in its deprotonated state. Peff is the effective permeability, and P0 is the unit factor corresponding to 1 cm s−1.

