Figure 1.
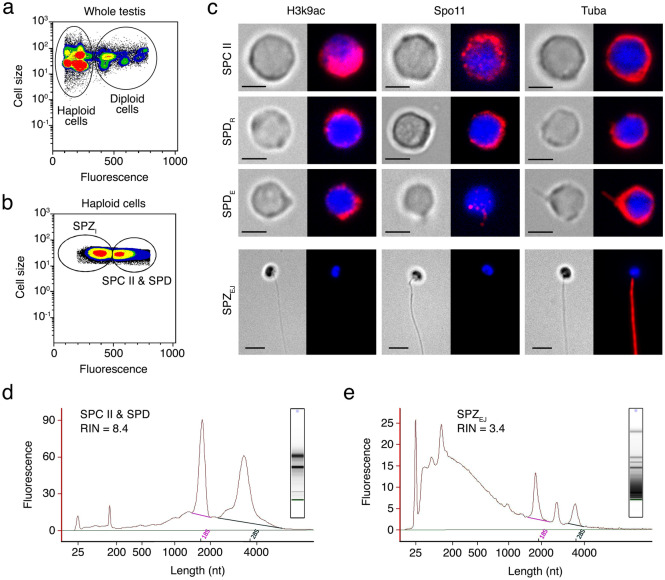
Isolation of testicular haploid germ cells and ejaculated spermatozoa from the seabream and RNA extraction. (a, b) Representative flow cytometry plots of the seabream cell populations in the whole testis before and after centrifugation generated with the MoFlo XDP cell sorter software (https://www.beckman.es/). In a, the populations of testicular haploid and diploid cells from the testis crude extract before centrifugation are encircled. In b, after centrifugation two subpopulations of haploid germ cells (HGCs) are recovered, one corresponding to a mix of type II spermatocytes (SPC II) and spermatids (SPD), and the other to intratesticular spermatozoa (SPZI). (c) Representative immunostaining of Lys9 acetylated histone 3 (H3K9ac), meiotic recombination protein Spo11 and α-tubulin (Tuba) in sorted HGC shown in b and ejaculated spermatozoa (SPZEJ). For each cell type the brightfield (left panels) and epifluorescence (right panels) images are shown. SPDR, round spermatids; SPDE, elongating spermatids. Scale bars, 2 and 5 µm. (d, e) Electrophoretic size distribution of RNAs in representative samples of SPCII + SPD (d) and SPZEJ (e) populations analyzed and plotted by the Agilent Bioanalyzer 2100 Expert Software (https://www.agilent.com/). For each sample, fluorescence is plotted against mRNA length (in nucleotides, nt). The RNA integrity number (RIN) is indicated for each sample.

