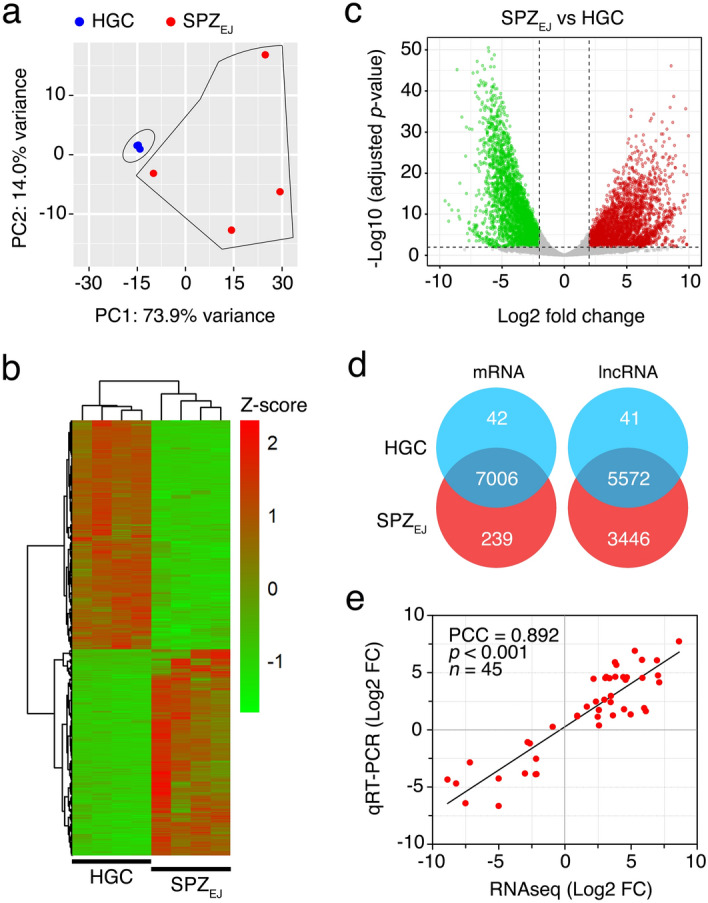
Figure 2.

RNA-seq data analysis of seabream HGC and SPZEJ. (a) Principal component analysis (PCA) using the top 500 most variable genes between HGC and SPZEJ (n = 4 pools) and the 'rlog' transformation of the counts. (b) Heatmap generated by unsupervised hierarchical clustering of RNAseq expression z-scores computed for the 7286 differentially expressed genes (DEGs) (p-adj < 0.01; Log2 fold change > 1) between HGC and SPZEJ. The heatmap was generated with the ‘pheatmap’ R package (https://CRAN.R-project.org/package=pheatmap). (c) Volcano plot representation of DEGs in the SPZEJ versus HGC comparison. The x-axis shows Log2 fold changes in expression and the y-axis the negative logarithm of their p-value to base 10. Red and green points mark the genes with significantly increased or decreased expression respectively in SPZEJ compared to HGC (FDR < 0.01). (d) Venn diagrams showing the number of HGCs- and SPZEJ-specific and common mRNAs and lncRNAs (in intersect region) which are differentially expressed between the two stages. The Venn diagrams and volcano plots were performed with the ‘VenDiagramm’ R package (https://CRAN.R-project.org/package=VennDiagram) and ‘ggplot2’ R package (https://ggplot2.tidyverse.org), respectively. (e) Validation of the RNAseq data by qRT-PCR. The plot represents the Pearson's correlation analysis of DEGs in HGC and SPZEJ determined by RNAseq and qRT-PCR. The Pearson’s correlation coefficient (PCC) of the Log2 fold change analyzed by RNAseq (x-axis) and using qRT-PCR (y-axis), the p-value, and the number of DEGs analyzed are indicated. Plots in a, d and e were generated using the GraphPad Prism v8.4.3 (686) software (https://www.graphpad.com/).
