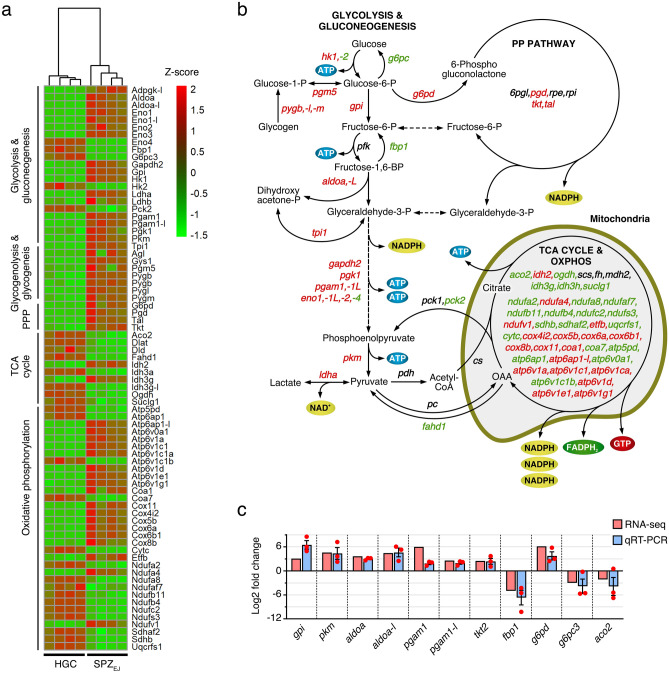
Figure 5.
Analysis and mapping of DEGs potentially involved in respiratory pathways in seabream spermatozoa. (a) Hierarchical clustering heatmap of RNA-seq expression z-scores computed for genes encoding enzymes potentially involved in carbohydrate metabolism, penthose phosphate pathway (PPP), tricarboxylic acid (TCA) cycle, and oxidative phosphorylation (OXPHOS), that are differentially expressed (p-adj < 0.01; Log2 fold change > 1) between HGC and SPZEJ. The map was generated with the ‘pheatmap’ R package (https://CRAN.R-project.org/package=pheatmap). (b) Schematic diagram of the biochemical pathways of glycolysis/gluconeogenesis, PPP, TCA cycle and OXPHOS. Enzyme-coding DEGs in green and red color denotes downregulation and upregulation, respectively, whereas black color indicates no change in the expression levels. The diagram was generated using CorelDRAW Graphics Suite 2021.5 (https://www.coreldraw.com/). (c) Validation of the changes in expression of 11 selected genes classified into respiratory pathways by qRT-PCR. Data from qRT-PCR are the mean ± SEM (n = 3 pools of 3 different fish each) and were plotted using the GraphPad Prism v8.4.3 (686) software (https://www.graphpad.com/).

