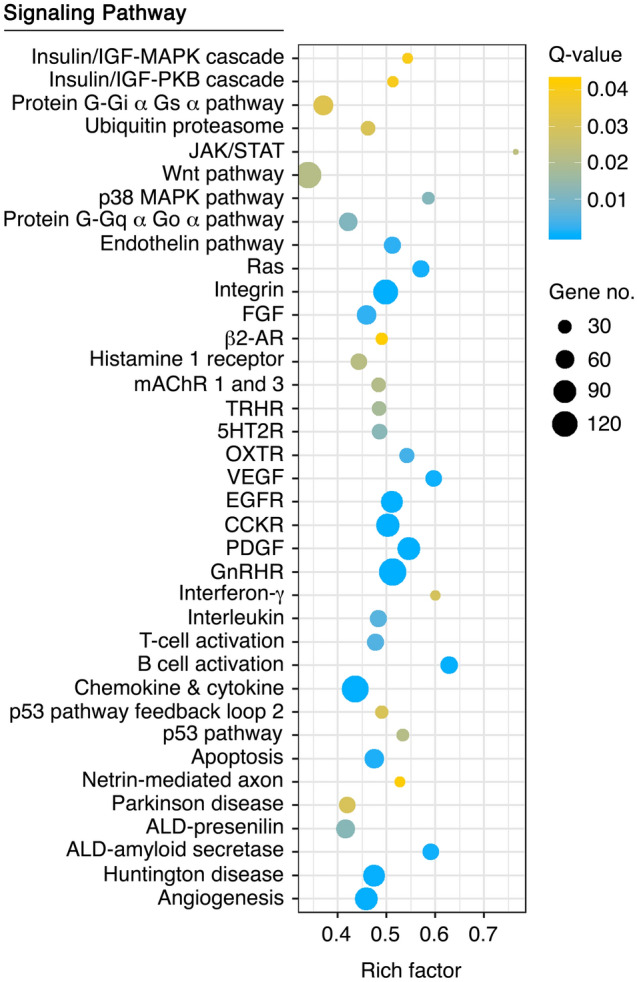
Figure 6.

Pathway enrichment analysis among DEGs during spermatozoa differentiation and maturation using the PANTHER Classification System. The plot generated with the ‘ggplot2’ R package (https://ggplot2.tidyverse.org) shows the 37 most highly enriched signaling pathways (FDR < 0.05) in SPZEJ. The left Y-axis shows the PANTHER pathway, whereas the X-axis shows the rich factor. A high Q-value is represented by yellow and a low Q-value is represented by blue.
