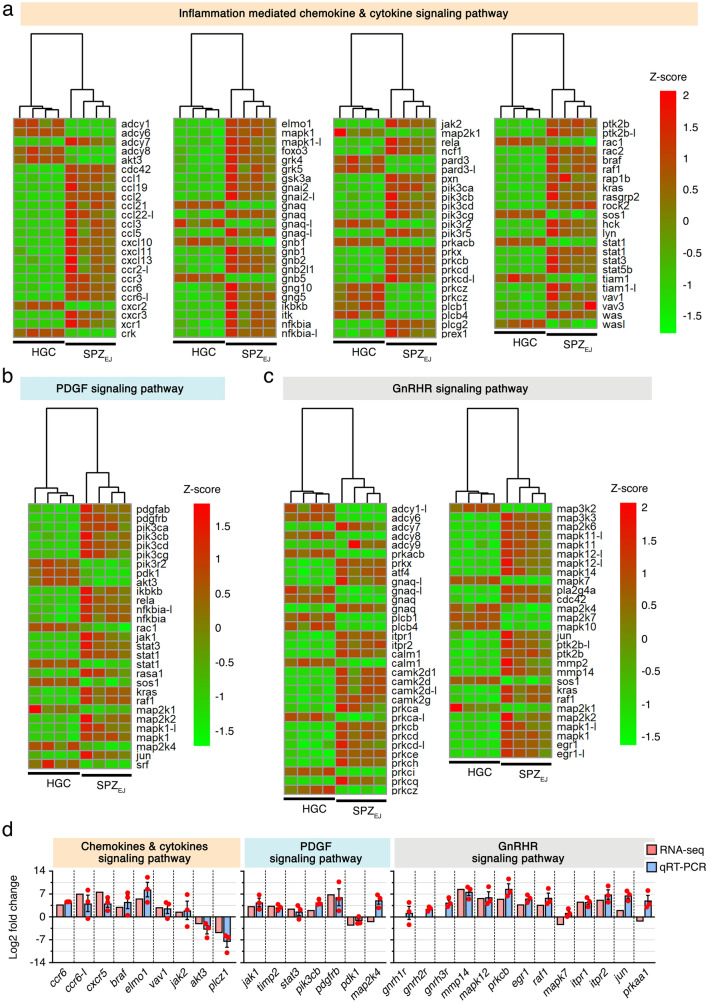
Figure 7.
Hierarchical clustering heatmaps of RNA-seq expression for genes potentially involved in the inflammatory chemokine and citokine (a), PDGF (b) and GnRHR (c) signaling pathways. The maps were generated with the ‘pheatmap’ R package (https://CRAN.R-project.org/package=pheatmap). (d) qRT-PCR validation of the changes in expression of selected genes classified into these pathways. Data from qRT-PCR are the mean ± SEM (n = 3 pools of 3 different fish each) and were plotted using the GraphPad Prism v8.4.3 (686) software (https://www.graphpad.com/).

