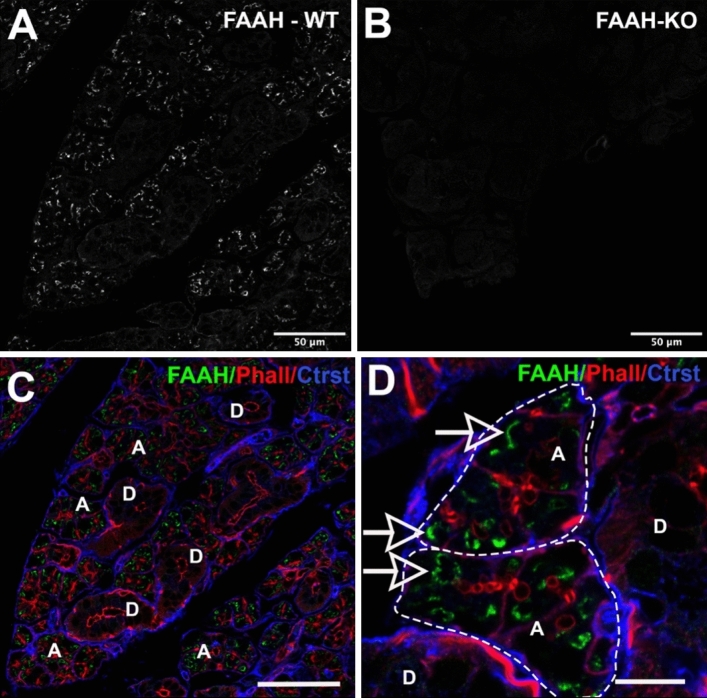
Figure 5.
FAAH protein expression in acini of submandibular gland. (A,B) FAAH expression in (A) WT and (B) FAAH knockout submandibular gland. (C) Triple-stain from (A) shows FAAH (green) relative to phalloidin (red) and a counterstain that outlines acini. FAAH is seen in acini “A” but not ducts “D”. (D) Higher magnification image shows FAAH staining in acini “A”, outlined but not ducts “D”. Scale bars: (A–C) 50 µm; (D) 15 µm. Images processed using Adobe Photoshop vsn. 21.2 and FIJI (vsn 2.3.0/1.53q, available at https://imagej.net/Fiji/downloads).

