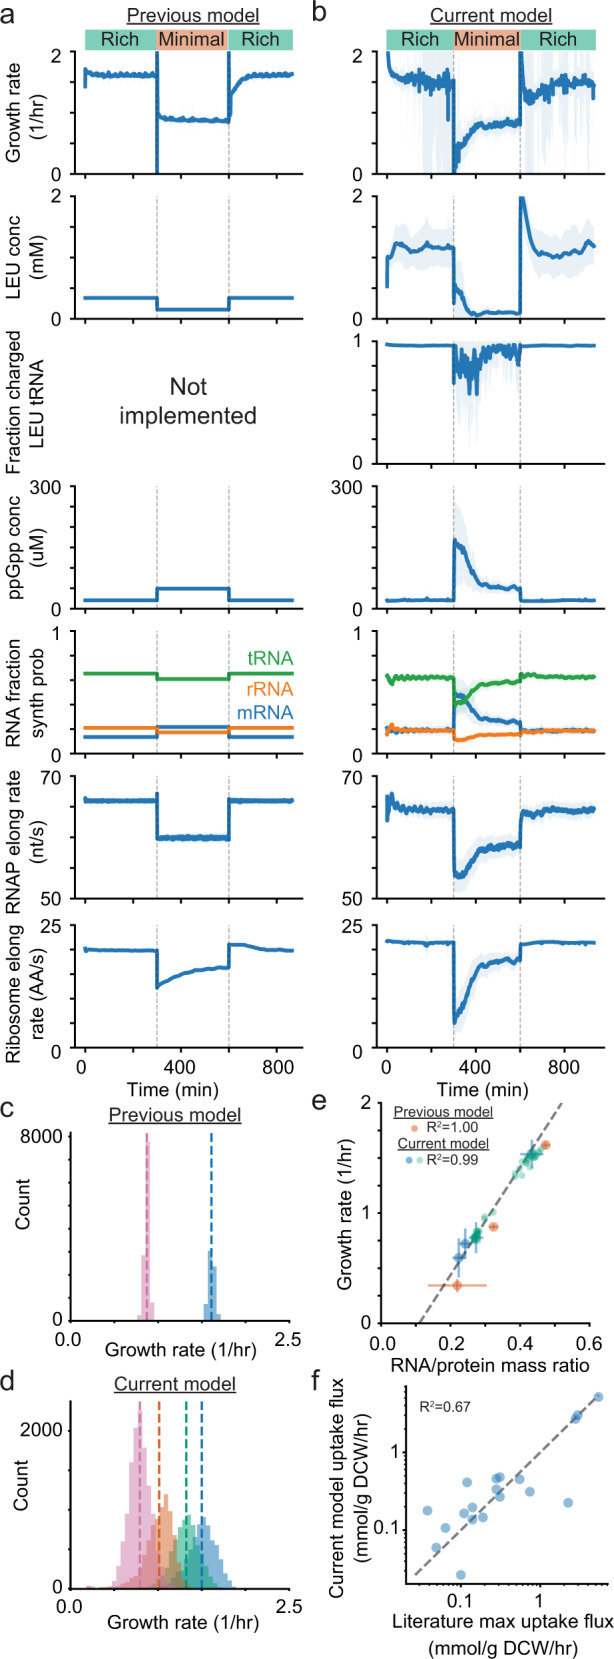
Fig. 2. Incorporation of the growth rate model results in simulation responses to environments and environmental shifts that are more accurate for well-characterized environments, and more biologically reasonable in less well-characterized environments.

Time series data show a nutrient downshift (green to orange) following by a nutrient upshift (orange to green) over 28 cell generations in the previous model (a) and the current model (b). The mean of 32 initial seeds is shown as the dark blue line with the light blue region showing the standard deviation. c Distributions of growth rates from 24 generations and 24 initial seeds from the previous version of the model in minimal (pink) and rich (blue) media with dashed lines showing the mean value. d Distributions of growth rates from 24 generations and 24 initial seeds from the current version of the model with new conditions (orange and green) that are not directly parameterized and include arbitrary amino acid combinations in the media. e Relationship between growth rate and RNA/protein ratio for multiple environmental conditions. The three possible media conditions from the previous model are shown in orange, new media conditions used for parameterization (and simulated) are in blue, new media conditions that are not directly parameterized are in green. The dashed line is a reference fit to data reported in literature (Bremer and Dennis30). f Calculated amino acid uptake rates in the model compared to the maximum uptake rate observed during a growth time series in literature (Zampieri et al.31).
